A borehole drilling and investigation was conducted on March 28 – April 1 near the University House located north of the Berkeley campus. The borehole is 400 feet deep with a diameter of 6 inches. Figure 1 shows the borehole location and Figure 2 shows the drilling equipment. The soil profile at the test site was logged during the drilling process, and a geophysical logging was conducted after the drilling.
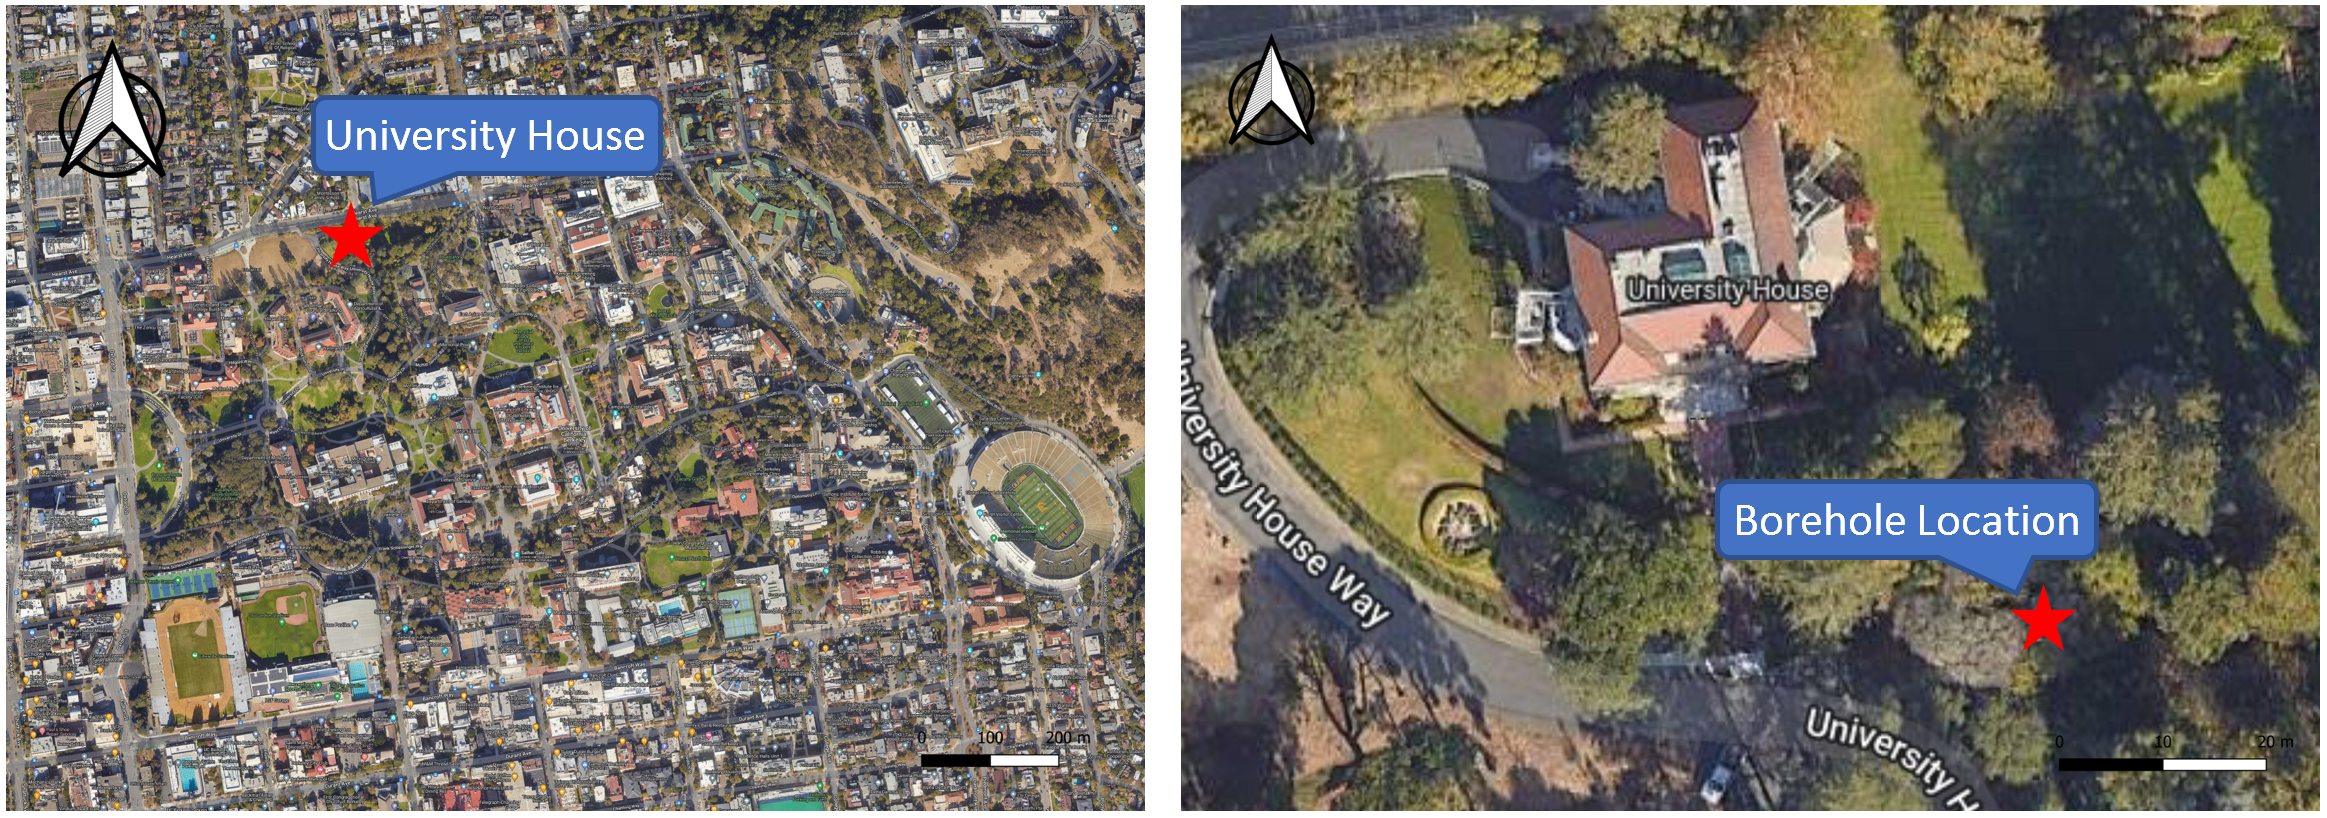
Figure 1 Location of the borehole
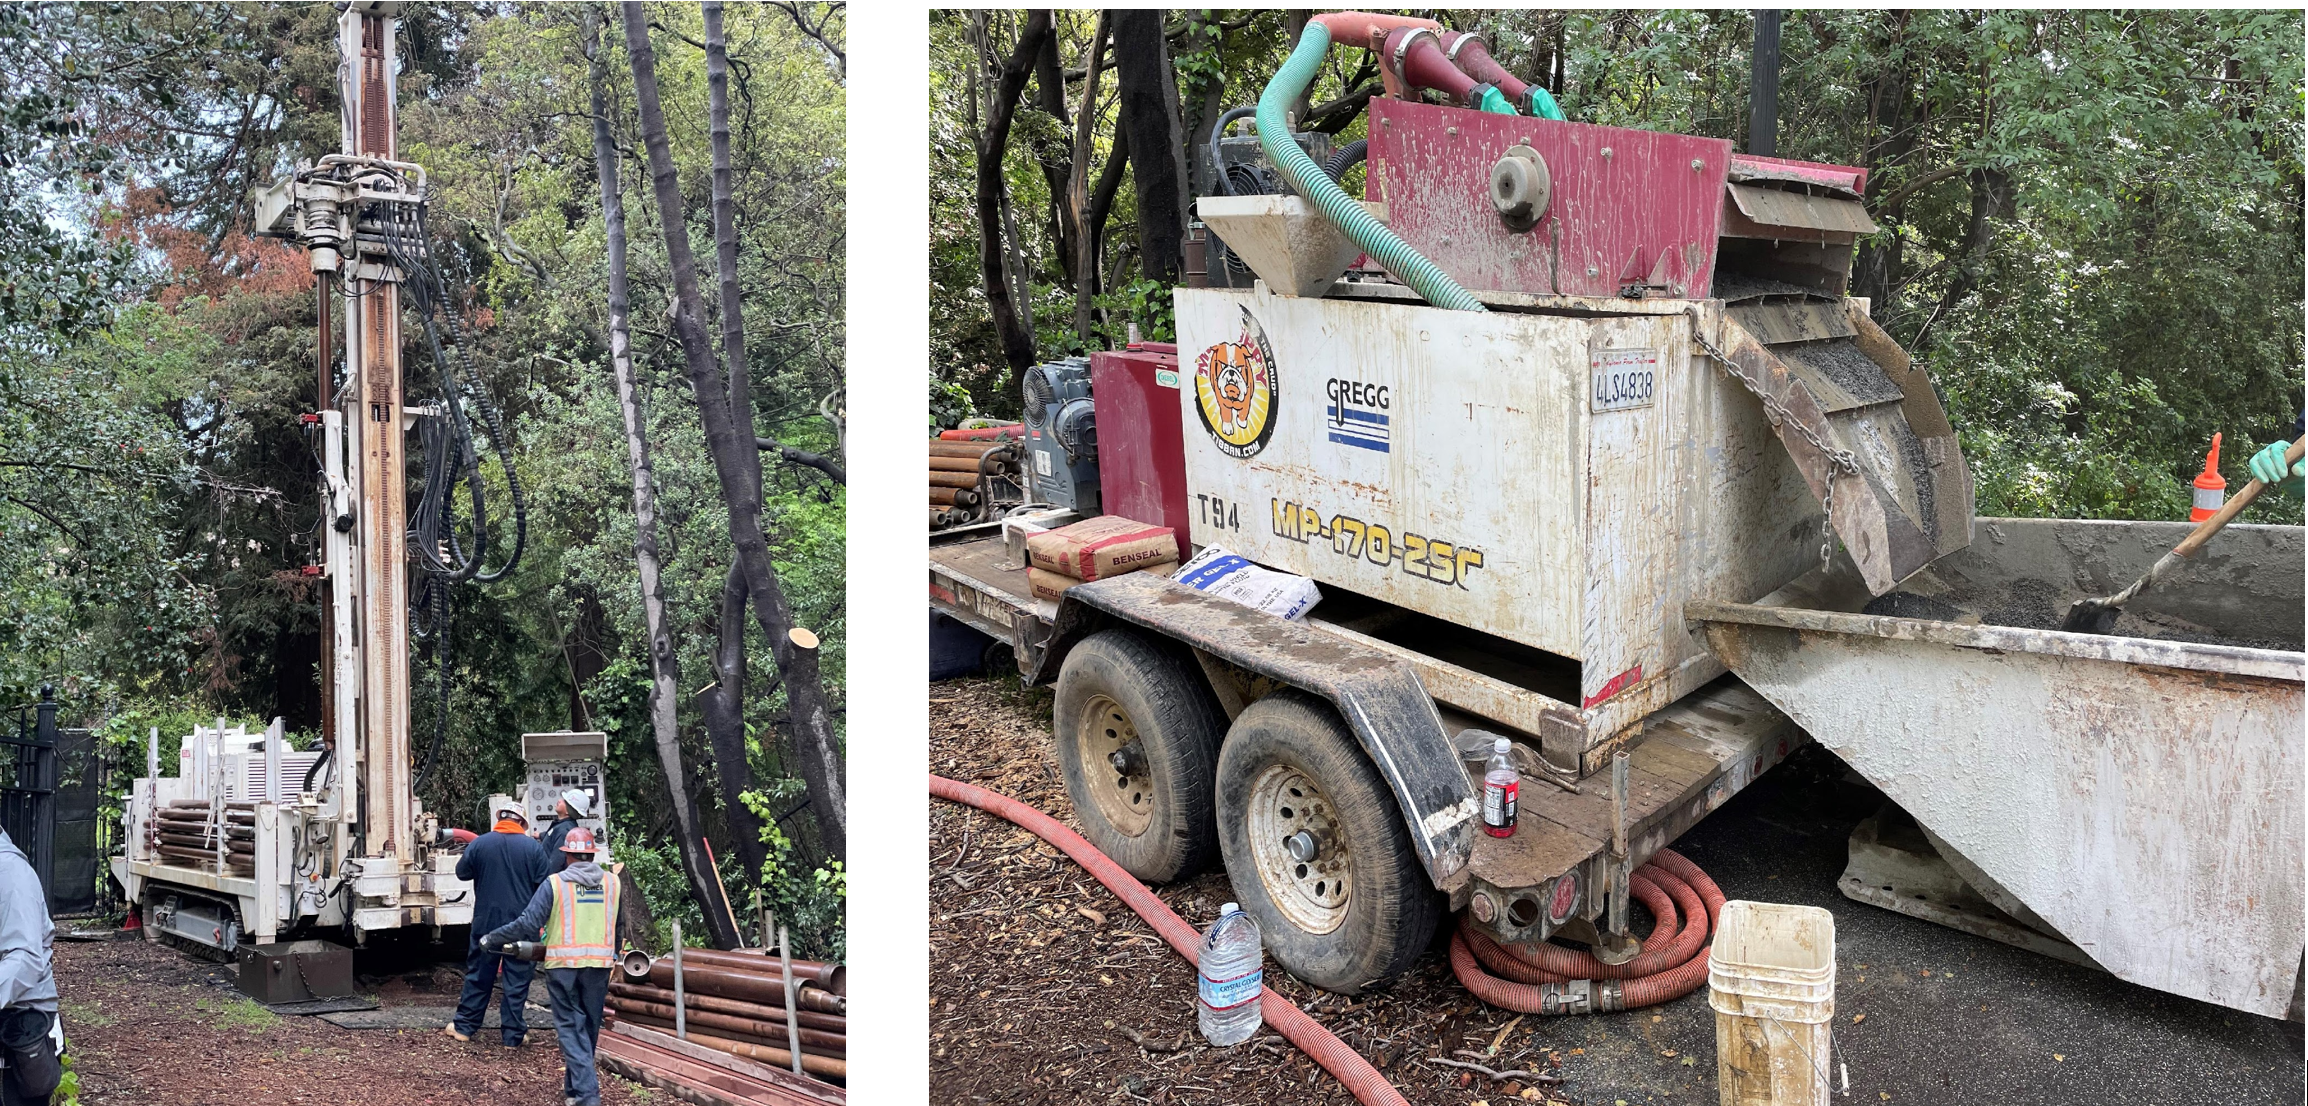
Figure 2 Rotary drilling rig and mud loop system
Borehole Logging
According to the boring log recorded during the drilling process, the ground beneath the investigation site can be divided into four layers as follows:
- Topsoil: 0 – 1 ft, clay with some grass and sawdust.
- Clay layer: 1 – 10 ft, yellowish clay with some gravel, trace reddish chert can be found, orange mottling indicates oxidation due to water table fluctuation.
- Gravel layer: 10 – 30 ft, sandy gravel is underlying the clay layer. It is multicolor, well-graded sandy gravel, trace clay can be found.
- Bedrock: 30 – 400 ft, the bedrock underlying the gravel layer is the Franciscan Complex. Sheared zones were identified at depths of 75 ft, 200 ft, 280 ft, and 330 ft.
Geophysical Logging
Geophysical logging investigation was conducted by the Norcal Team and primarily includes (i) a caliper survey for borehole stability analysis and diameter measure, (ii) a PS-wave Suspension survey to measure compression (P) and shear (S) wave velocity, (iii) a televiewer survey for discontinuity classification, and (iv) a natural gamma logging survey for stratigraphy mapping.
The geophysical logging shows that the borehole tilts less than 5° above the depth of 230 ft, and the tilt increases to 12 degrees at the bottom. This may affect the DTRT results, but there is no direct link between the tilt of the borehole and the anomaly in the DTRT results. The P-wave velocity profile can be divided into 2800 – 3350 ft/s (0 – 16 ft, sediment above water), 6000 – 8410 ft/s (18 – 23 ft, sediment below water), and 9000 – 18700 ft/s (below 24 ft, bedrock), whereas the S-wave velocity profile can be divided into 870 ft/s – 2570 ft/s (0 – 23 ft, sediment) and 3470 – 9380 ft/s (below 23 ft, bedrock).
Geophysical logging results are compared with the borehole logging in Figure 3. The geophysical logging identifies sheared zones at the depths of 75 ft, 170 ft, 200 ft, 240 ft, 280 ft, and 330 ft. It matches the boring log result and revels more potential sheared zones.
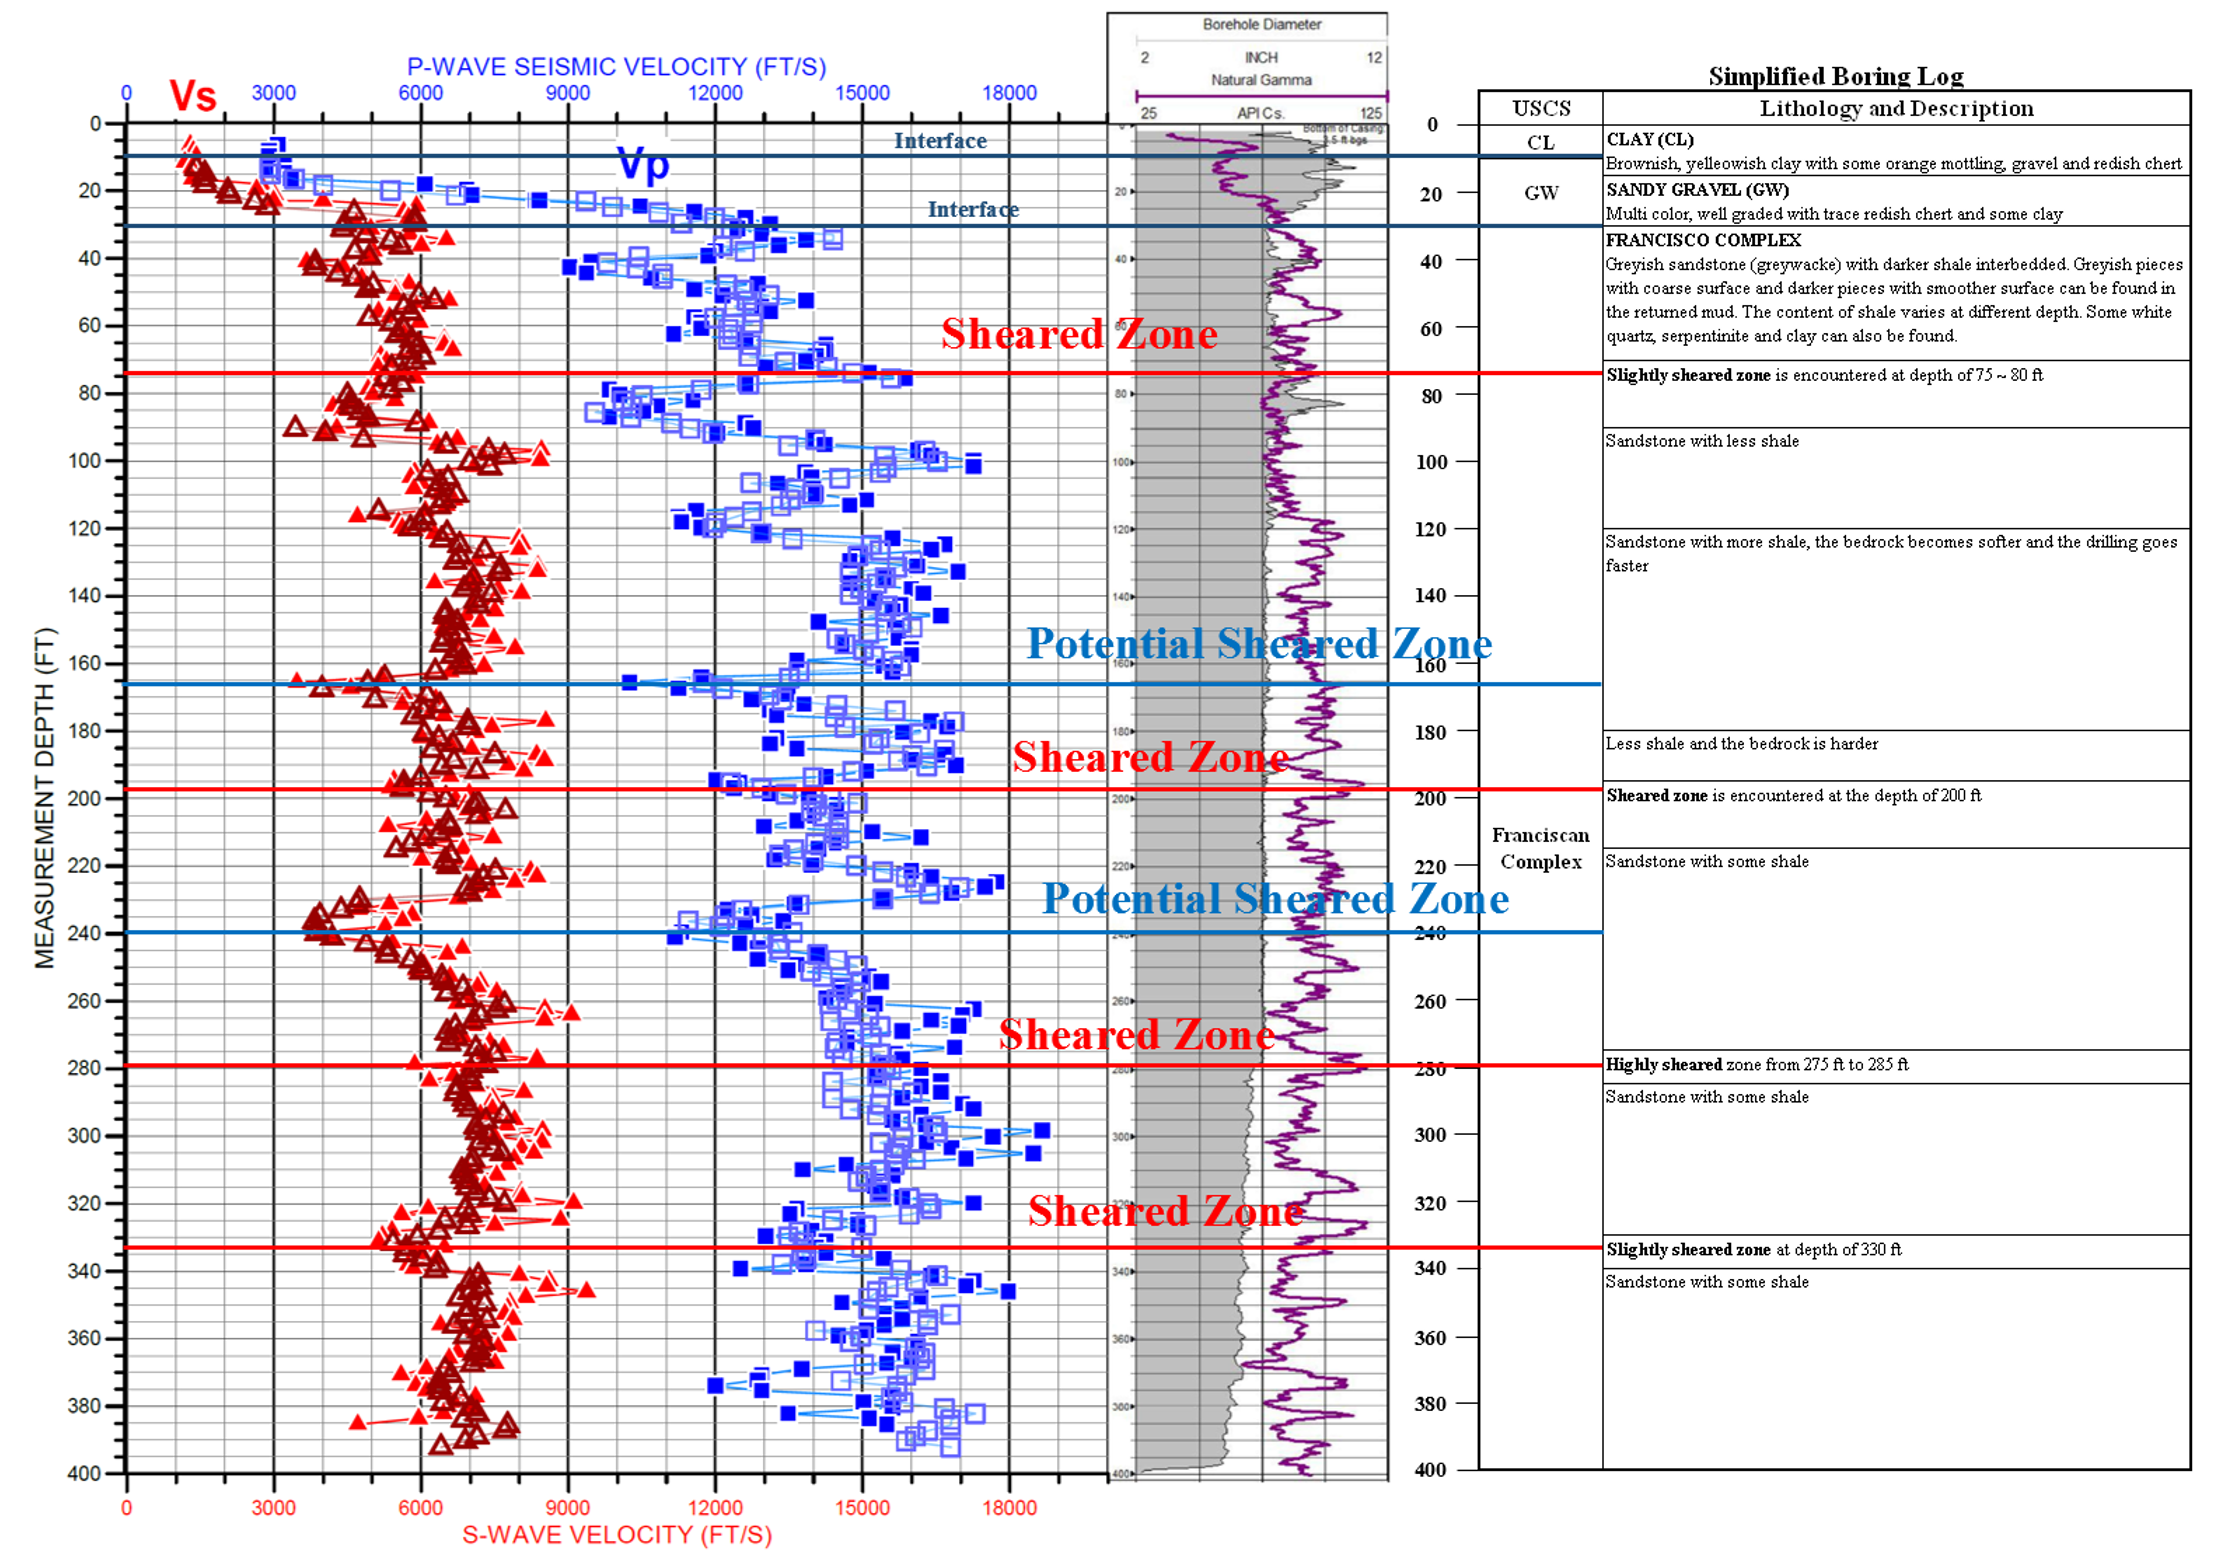
Figure 3 Comparison of Geophysical Log and Boring