First DTRT Using OMNISENS
Figure 1-1 2D Contours of Temperature Change (ΔT) Versus Depth and Time Recorded by DFOS inside the U-pipe (data is smoothed using 2d anisotropic gaussian filter)
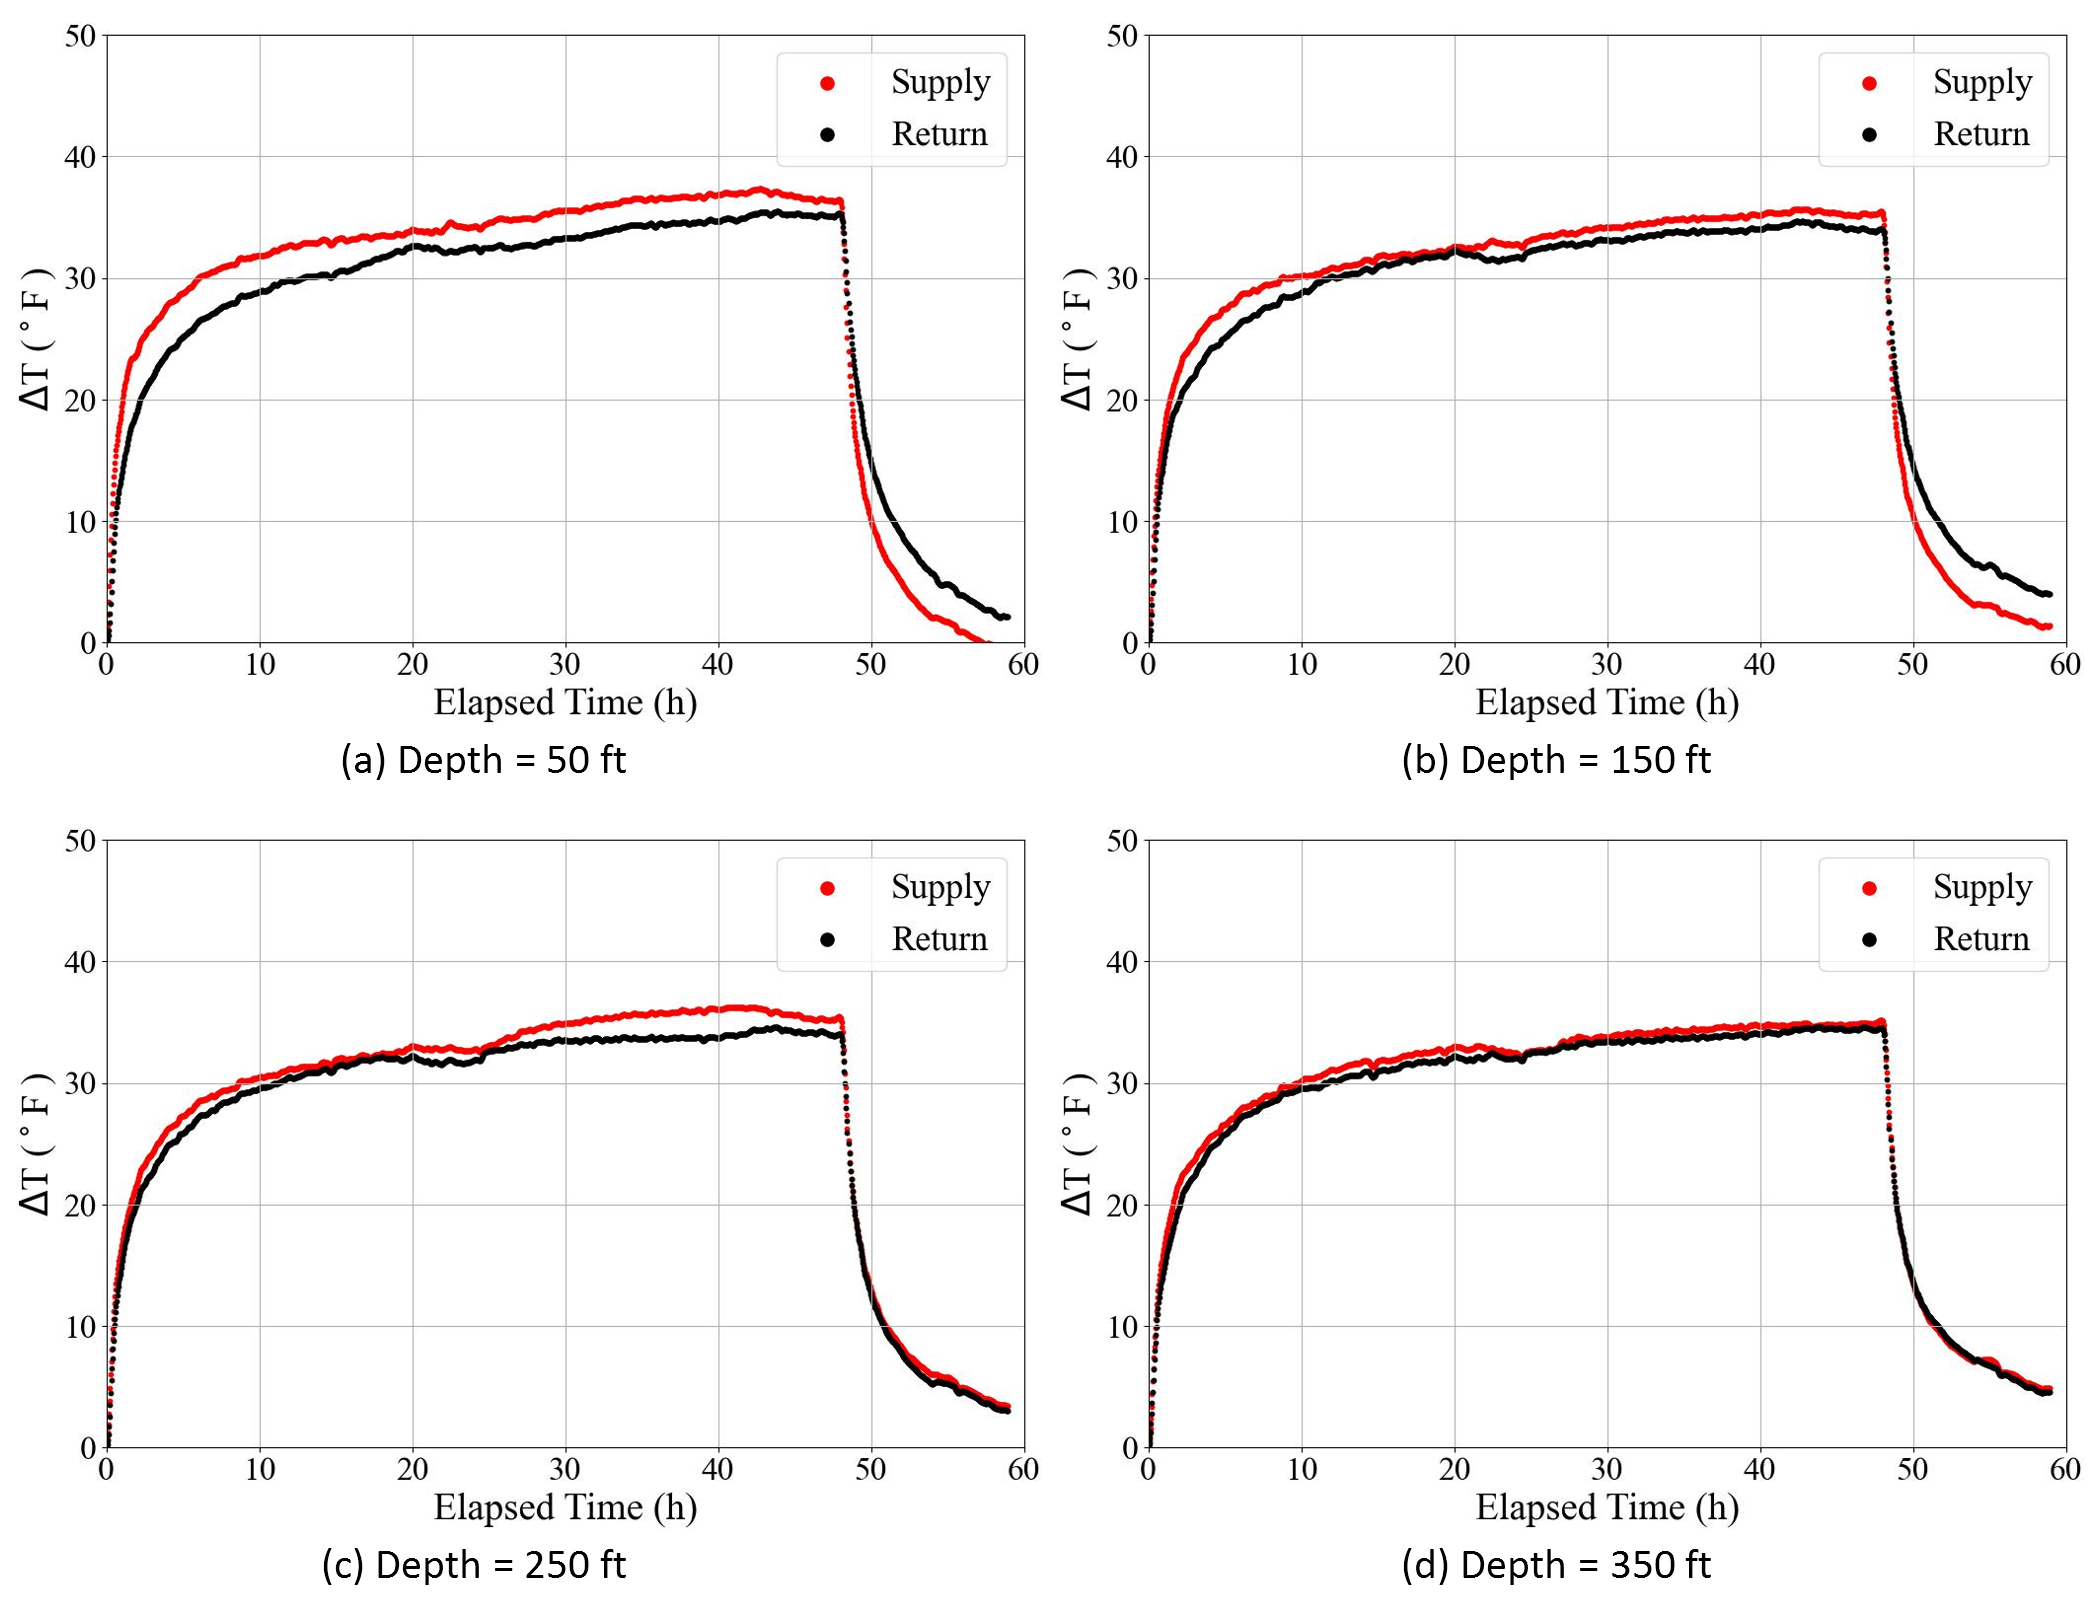
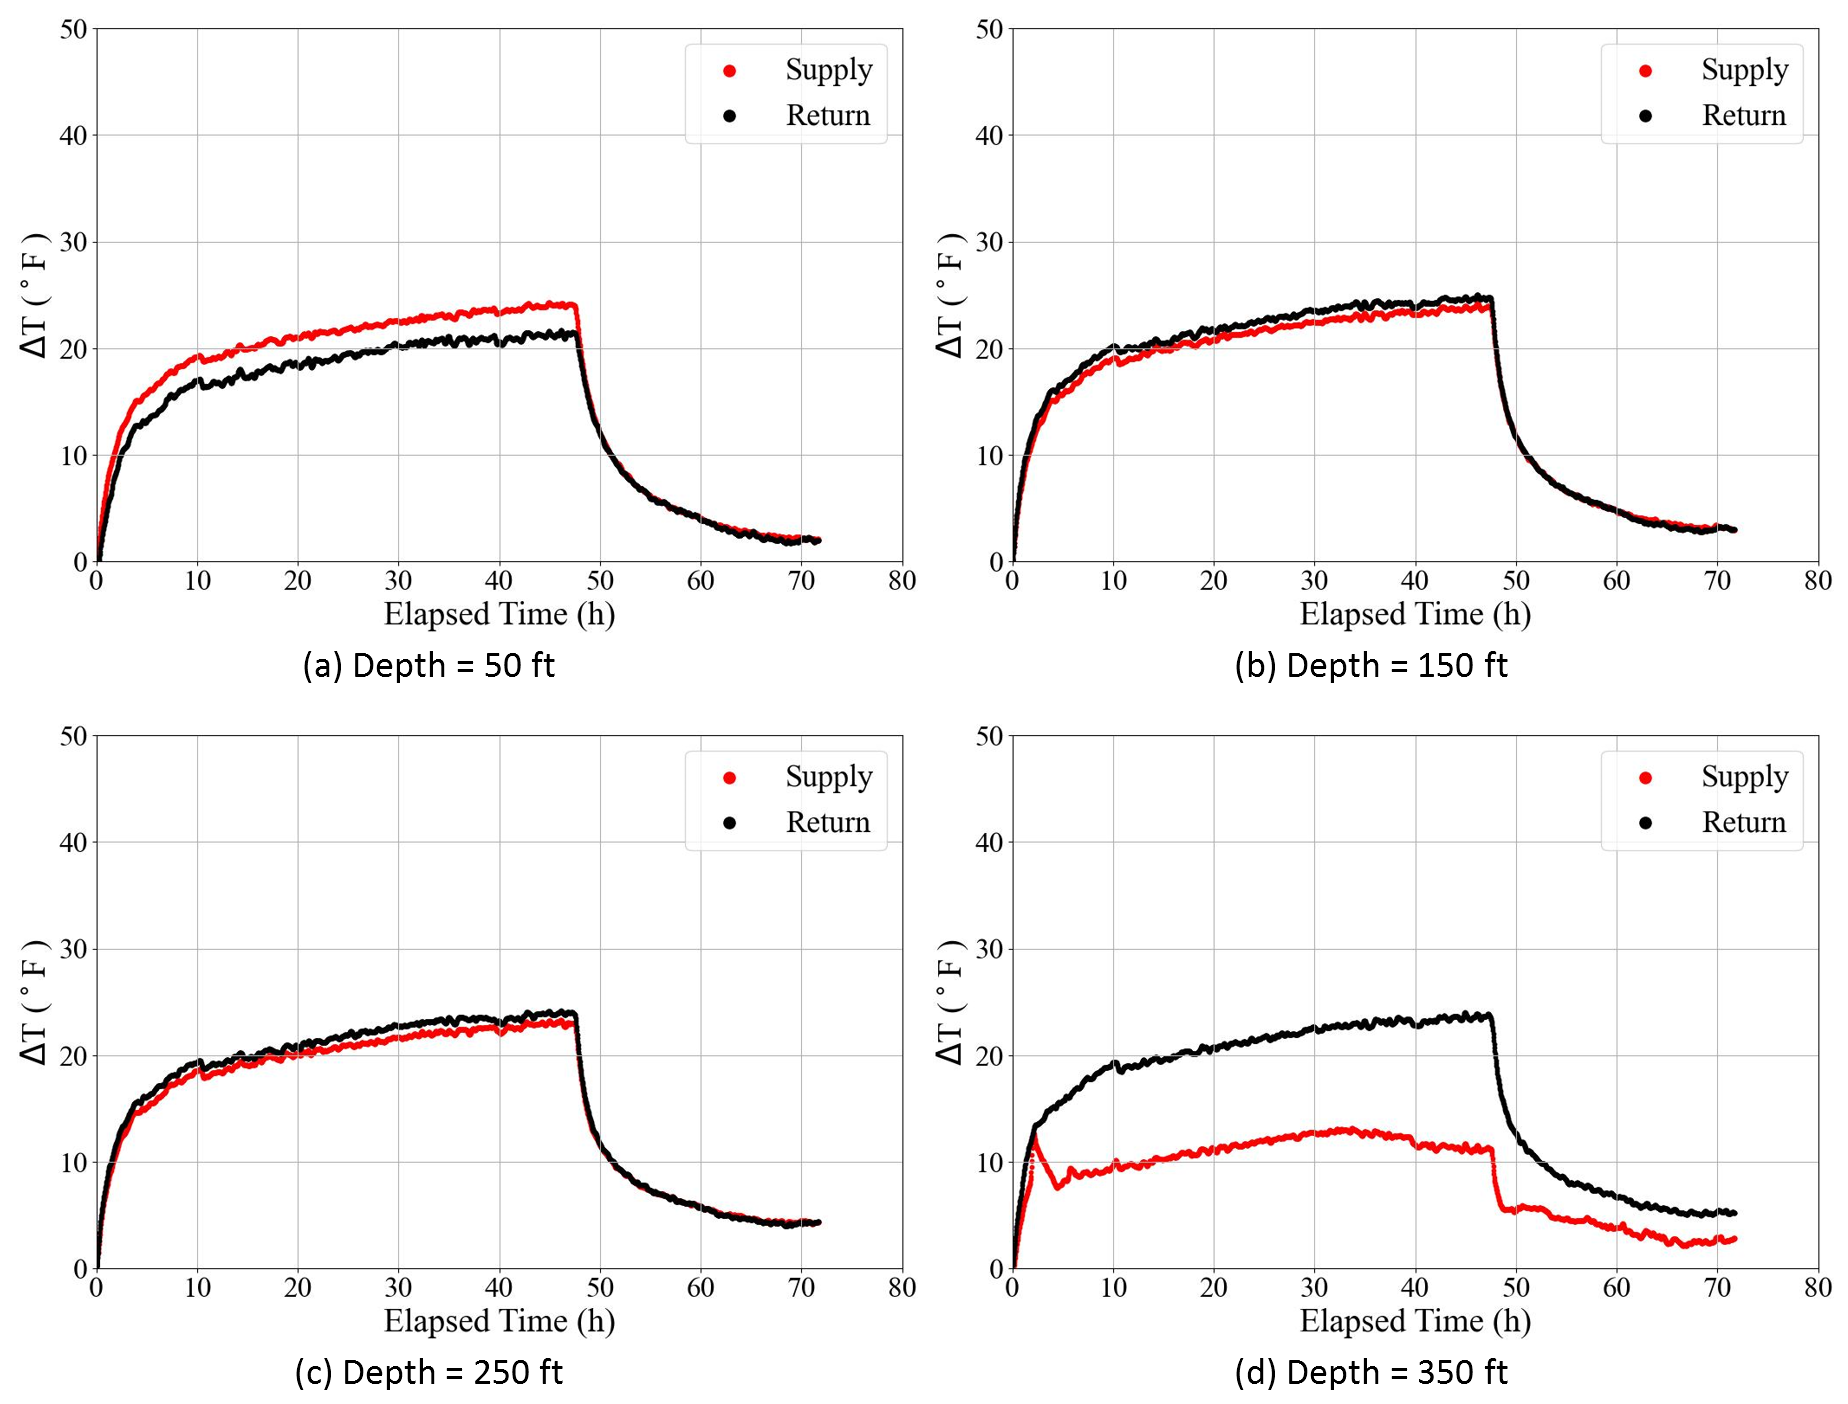
Figure 1-2 Curves of Temperature Change (ΔT) versus Elapsed Time at Different Depths Recorded by DFOS inside the U-pipe
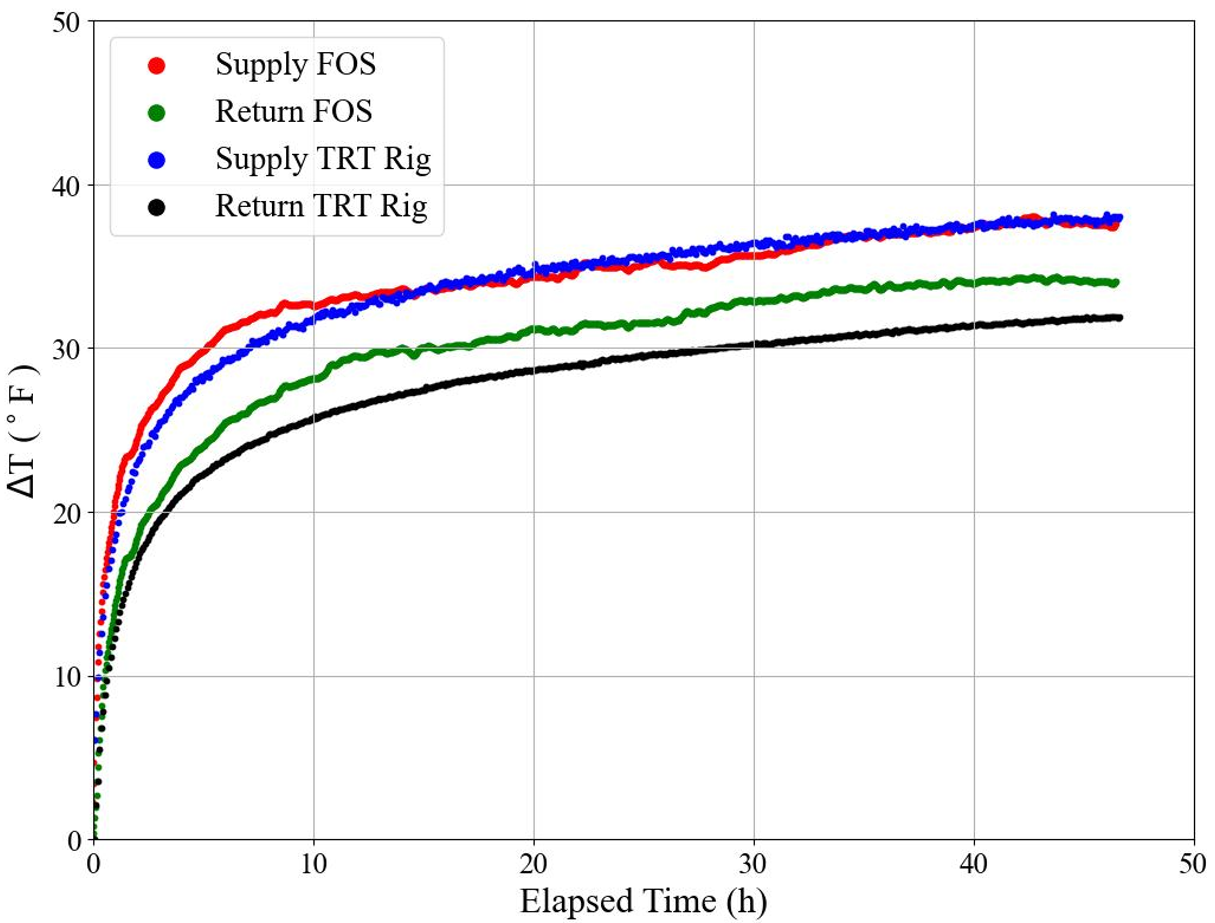
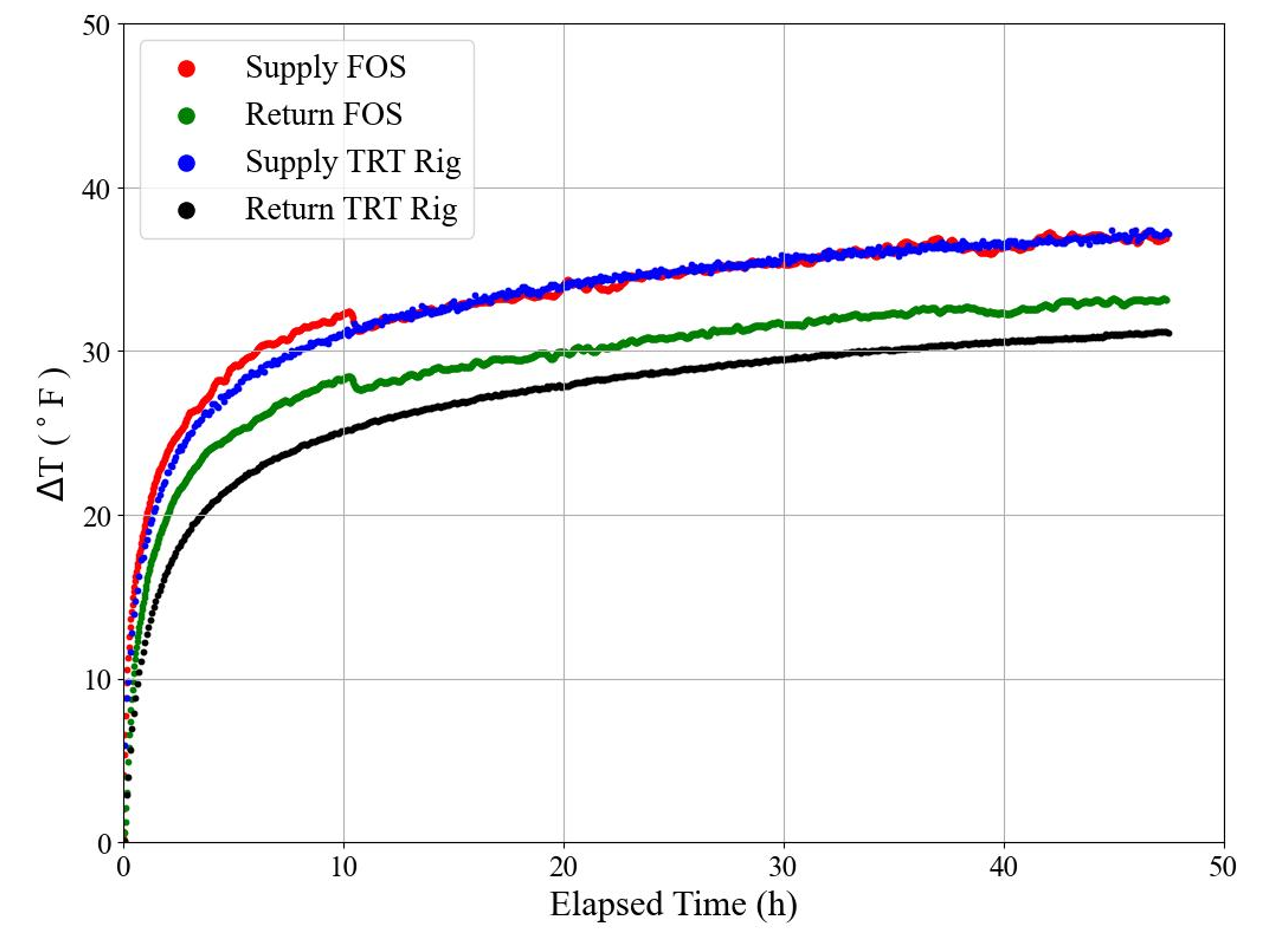
Figure 1-3 Comparison of Temperature Recorded by TRT Rig and DOFS inside the U-pipe(near the surface)
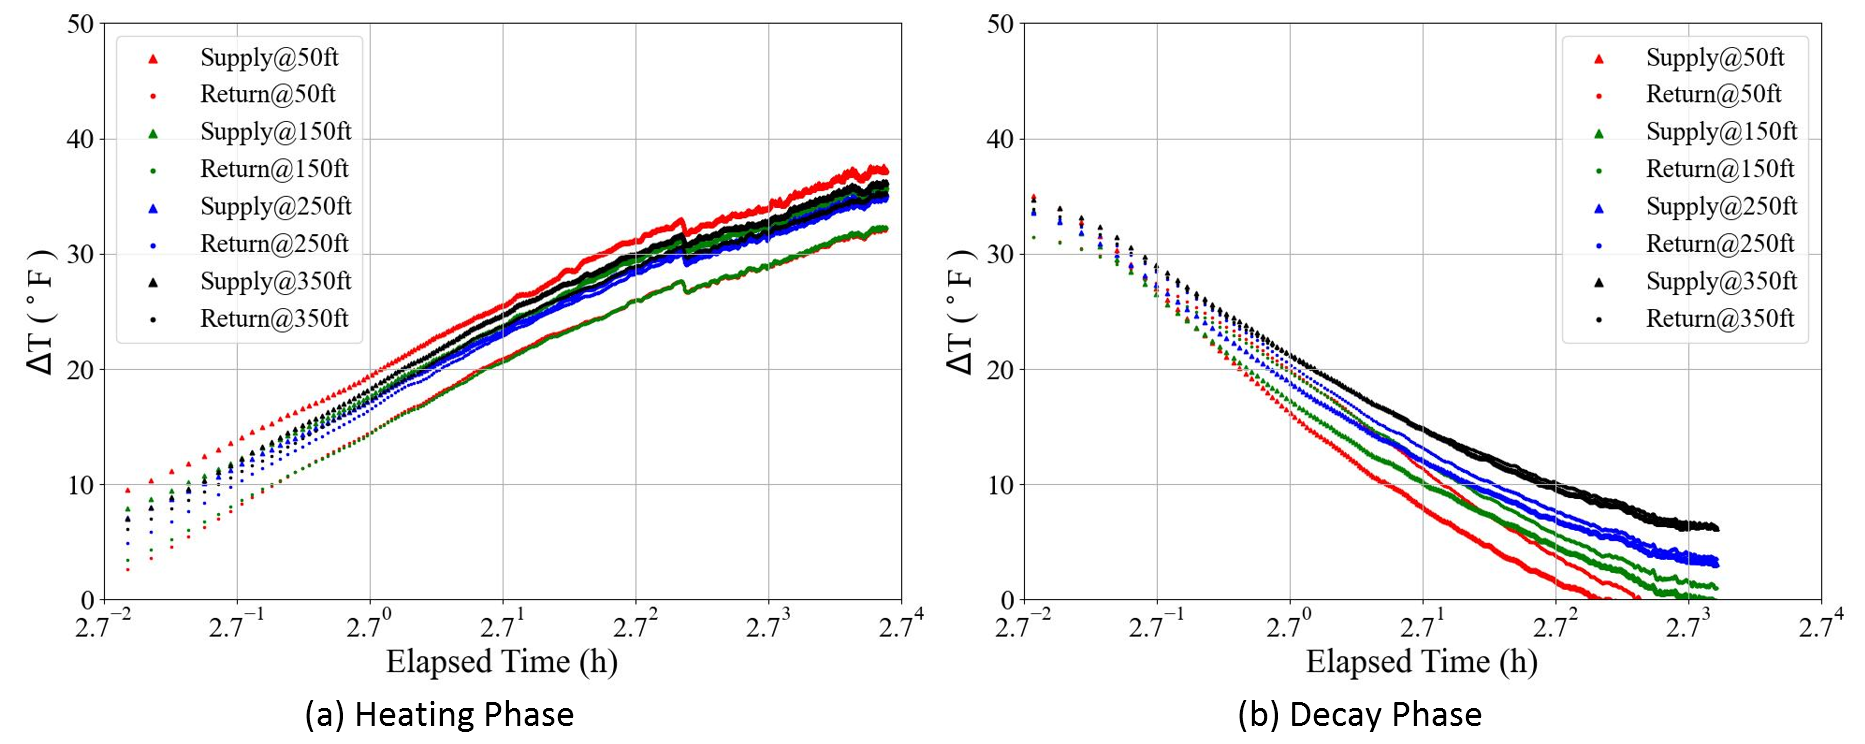
Figure 1-4 Curves of Temperature Change (ΔT) versus Elapsed Time Recorded by DFOS inside the U-pipe in Natural Log Scale
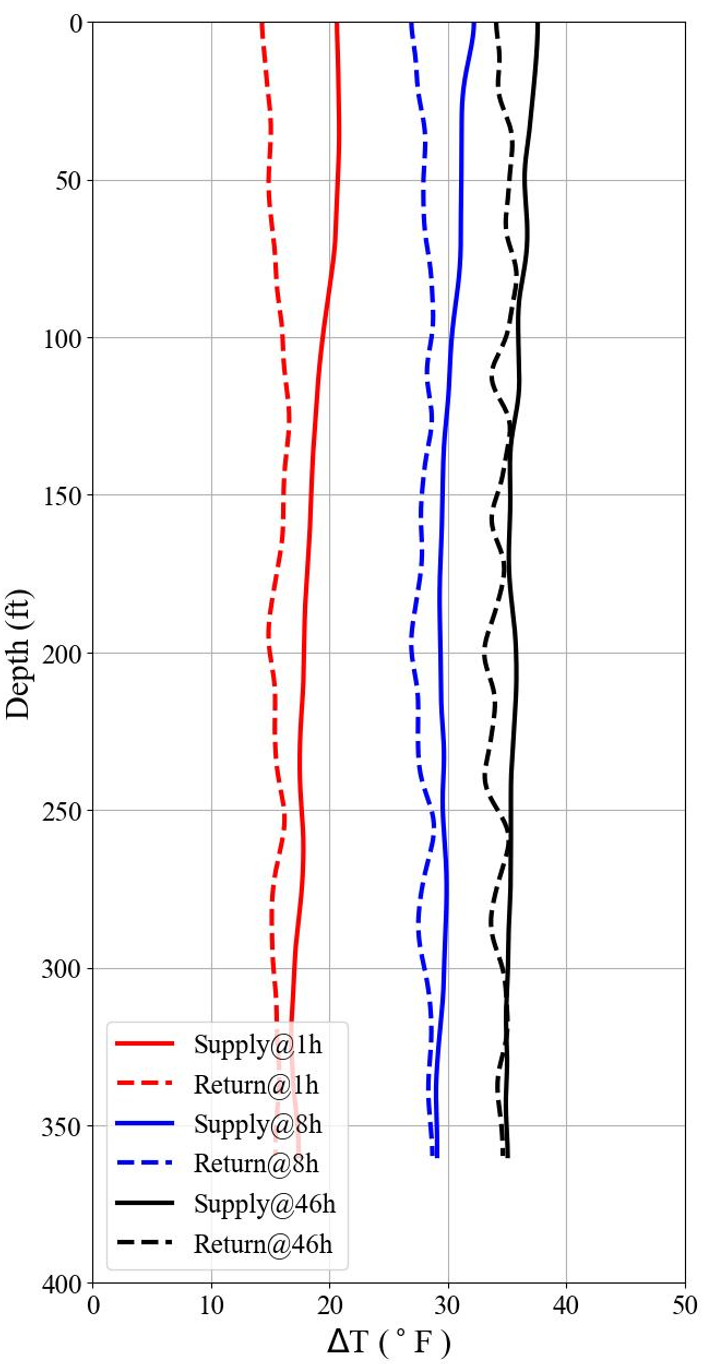
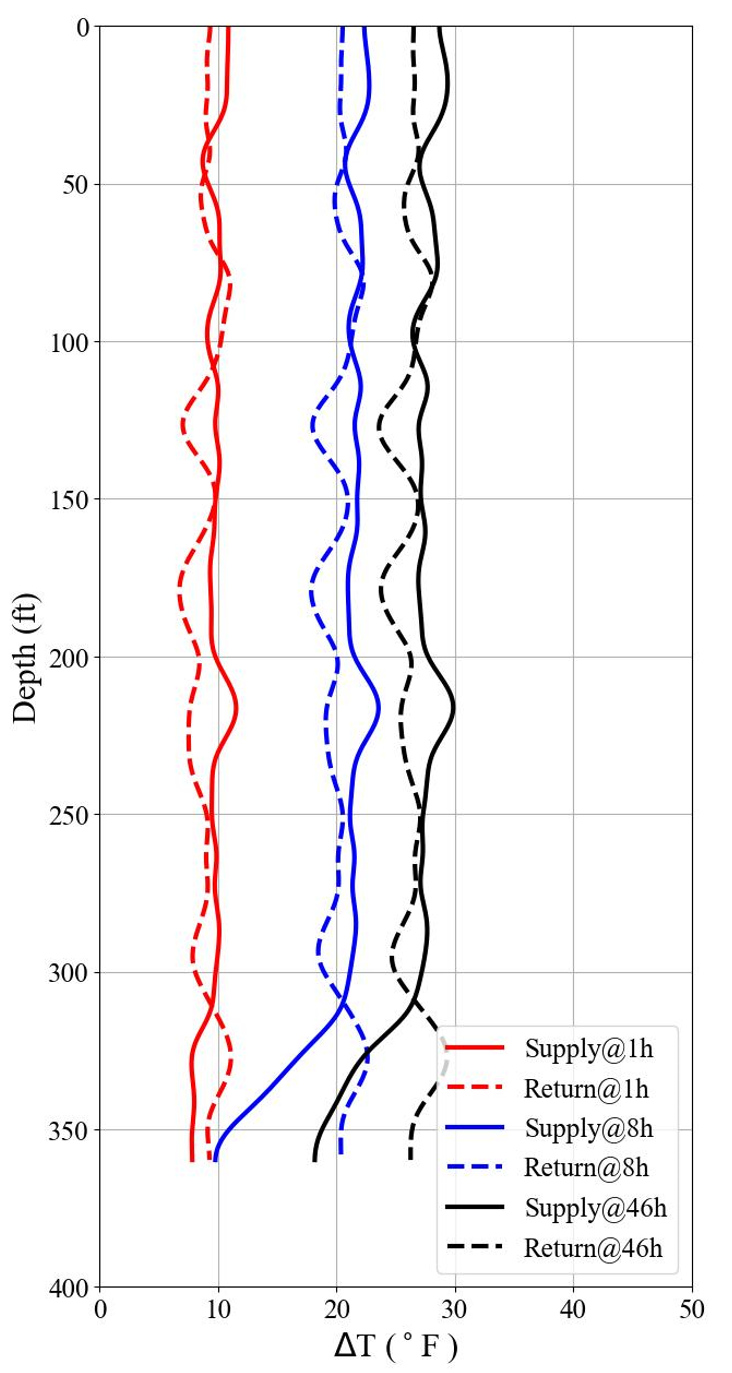
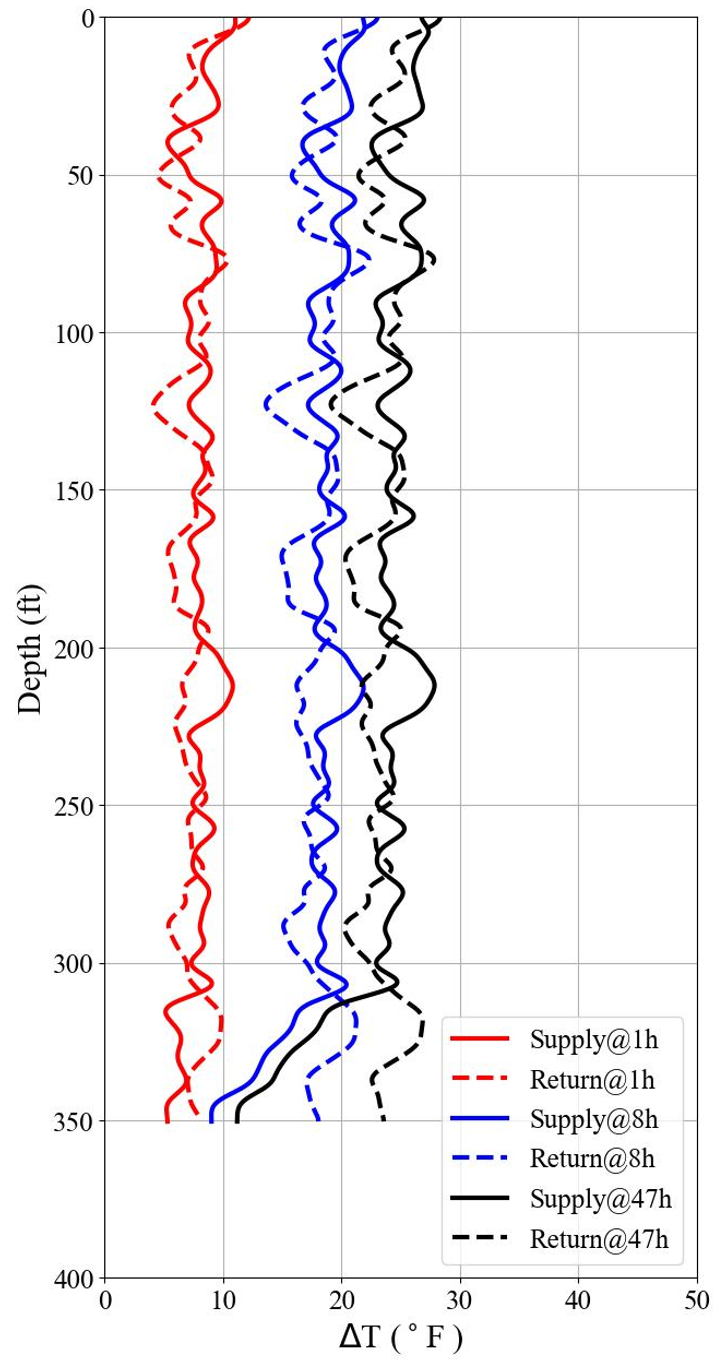
Figure 1-5 Curves of Temperature Change (ΔT) versus Depth at Different Time Recorded by DFOS inside the U-pipe
Figure 1-6 2D Contours of Temperature Change (ΔT) Versus Depth and Time Recorded by DFOS outside the U-pipe (data is smoothed using 2d anisotropic gaussian filter)
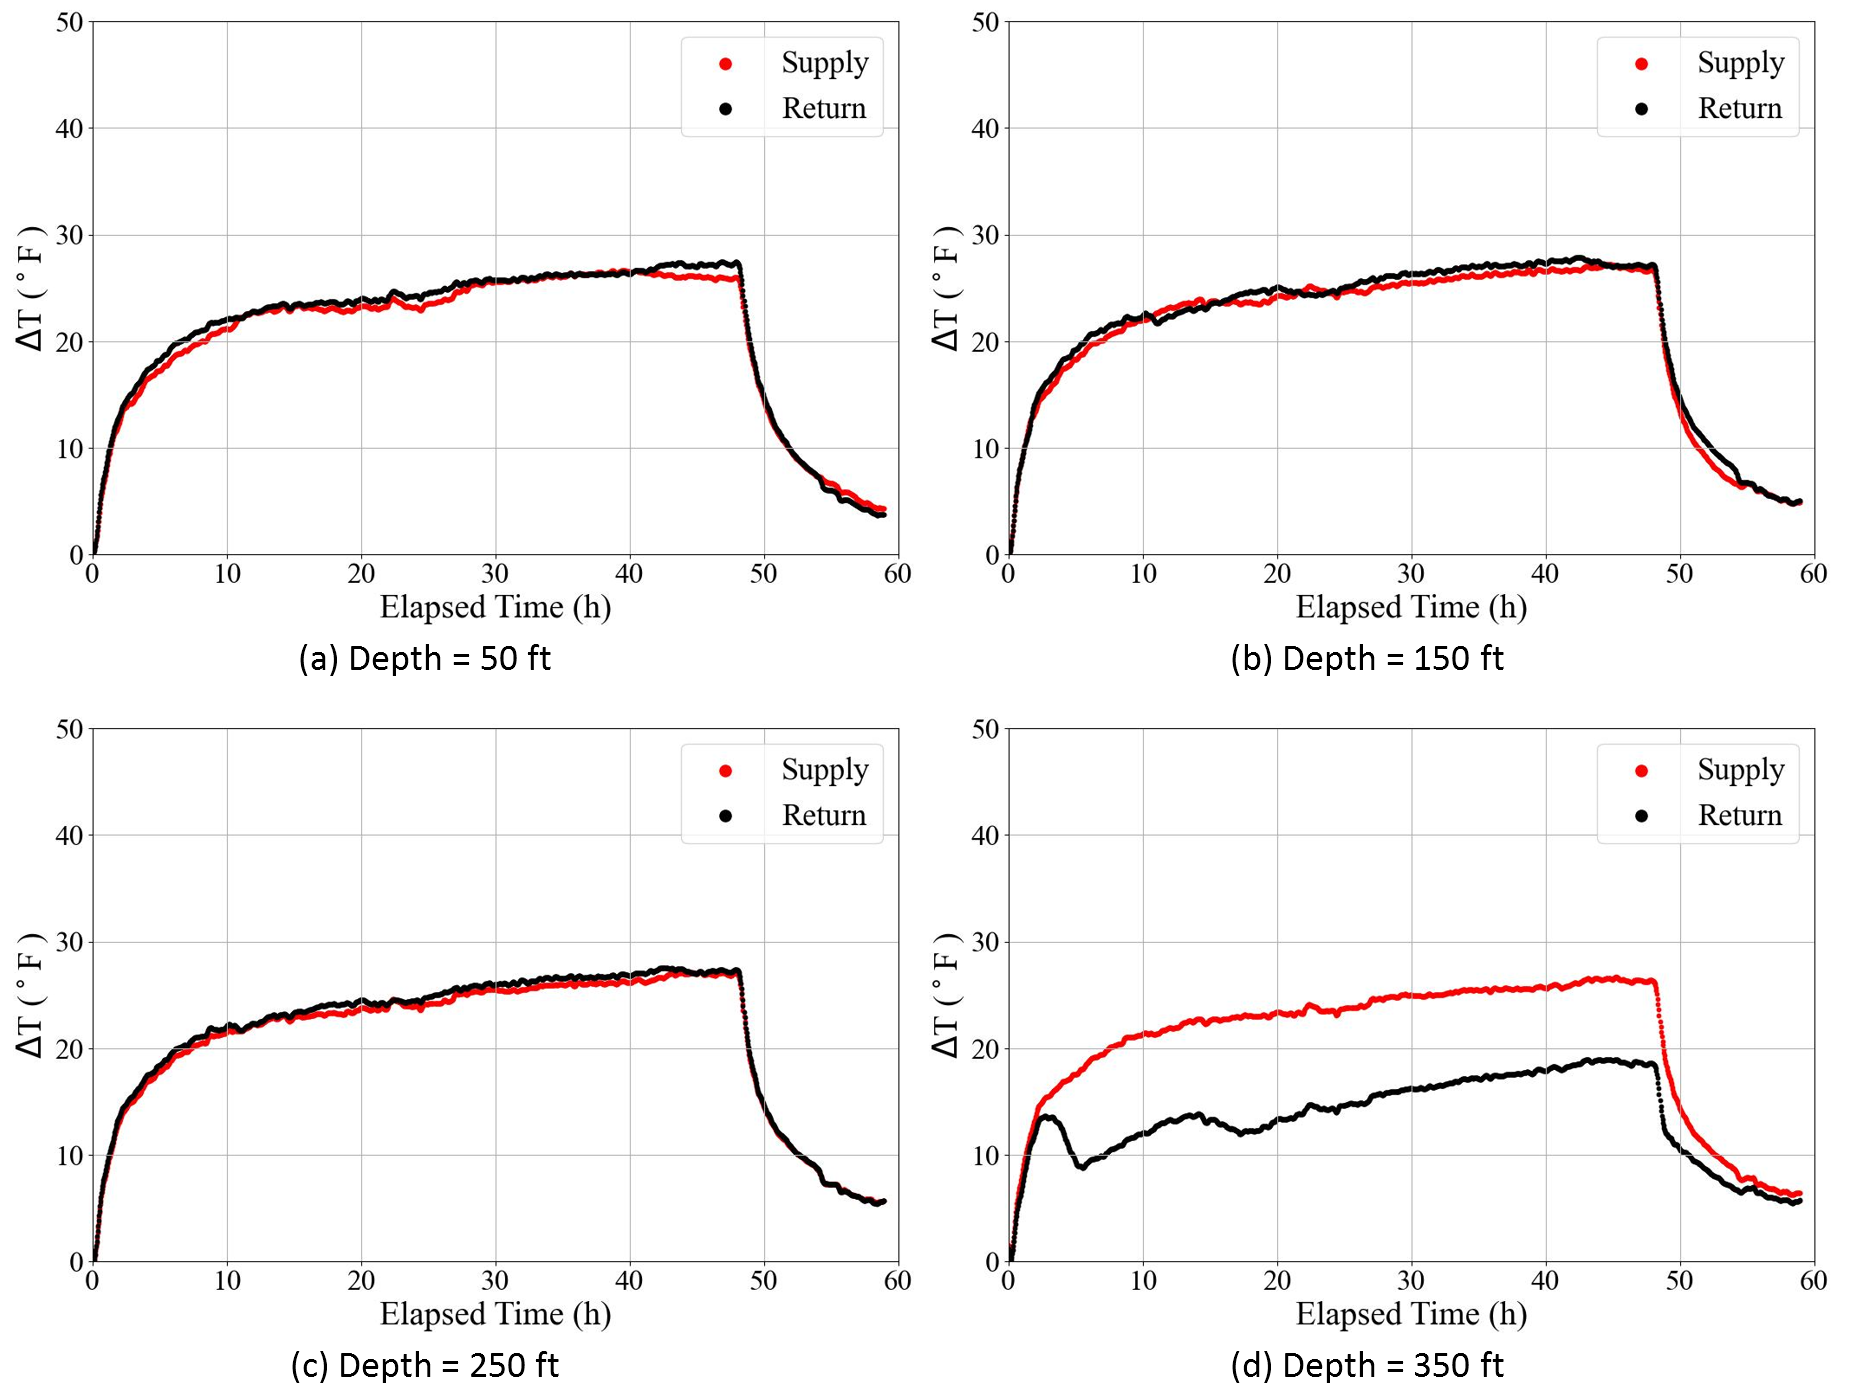
Figure 1-7 Curves of Temperature Change (ΔT) versus Elapsed Time at Different Depths Recorded by DFOS outside the U-pipe
Figure 1-8 Curves of Temperature Change (ΔT) versus Elapsed Time Recorded by DFOS outside the U-pipe in Natural Log Scale
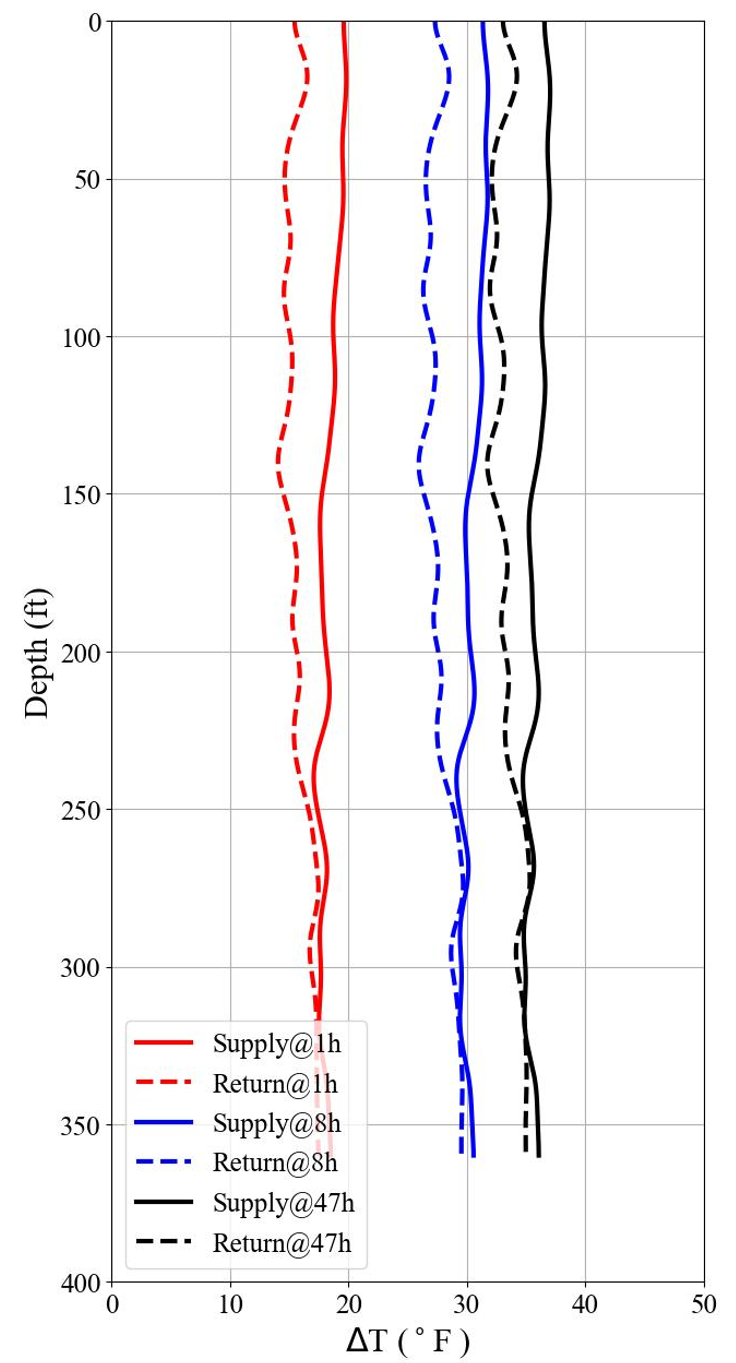
Figure 1-9 Curves of Temperature Change (ΔT) versus Depth at Different Time Recorded by DFOS outside the U-pipe
Second DTRT Using ALICIA
Figure 2-1 2D Contours of Temperature Change (ΔT) Versus Depth and Time Recorded by DFOS inside the U-pipe (data is smoothed using 2d anisotropic gaussian filter)
Figure 2-2 Curves of Temperature Change (ΔT) versus Elapsed Time at Different Depths Recorded by DFOS inside the U-pipe
Figure 2-3 Comparison of Temperature Recorded by TRT Rig and DOFS inside the U-pipe(near the surface)
Figure 2-4 Curves of Temperature Change (ΔT) versus Elapsed Time Recorded by DFOS inside the U-pipe in Natural Log Scale
Figure 2-5 Curves of Temperature Change (ΔT) versus Depth at Different Time Recorded by DFOS inside the U-pipe
Figure 2-6 2D Contours of Temperature Change (ΔT) Versus Depth and Time Recorded by DFOS outside the U-pipe (data is smoothed using 2d anisotropic gaussian filter)
Figure 2-7 Curves of Temperature Change (ΔT) versus Elapsed Time at Different Depths Recorded by DFOS outside the U-pipe
Figure 2-8 Curves of Temperature Change (ΔT) versus Elapsed Time Recorded by DFOS outside the U-pipe in Natural Log Scale
Figure 2-9 Curves of Temperature Change (ΔT) versus Depth at Different Time Recorded by DFOS outside the U-pipe

