The thermal response test (TRT) is a conventional testing method measuring the geothermal properties of the ground. It is conducted in a geothermal heat exchanger where a U-pipe is installed inside a borehole. In the test, water is heated by a constant input heat and circulated in the U-pipe, and temperature change is recorded to estimate geothermal properties. However, limited by analytical method and temperature monitoring techniques, conventional TRT can only evaluate the average geothermal properties without considering the variation along the depth.
Distributed fiber optic sensor (DFOS) was adopted in TRT, and two distributed thermal response tests (DTRTs) were performed on the 400 feet borehole. DFOS was installed both inside and outside the borehole as shown in Figure 1. Two DFOS analyzers, Brillouin Optical Time Domain Analyzer (OMNISENS) and Brillouin Optical Time Domain Reflectometer (ALICIA), were used in two DTRTs, respectively.
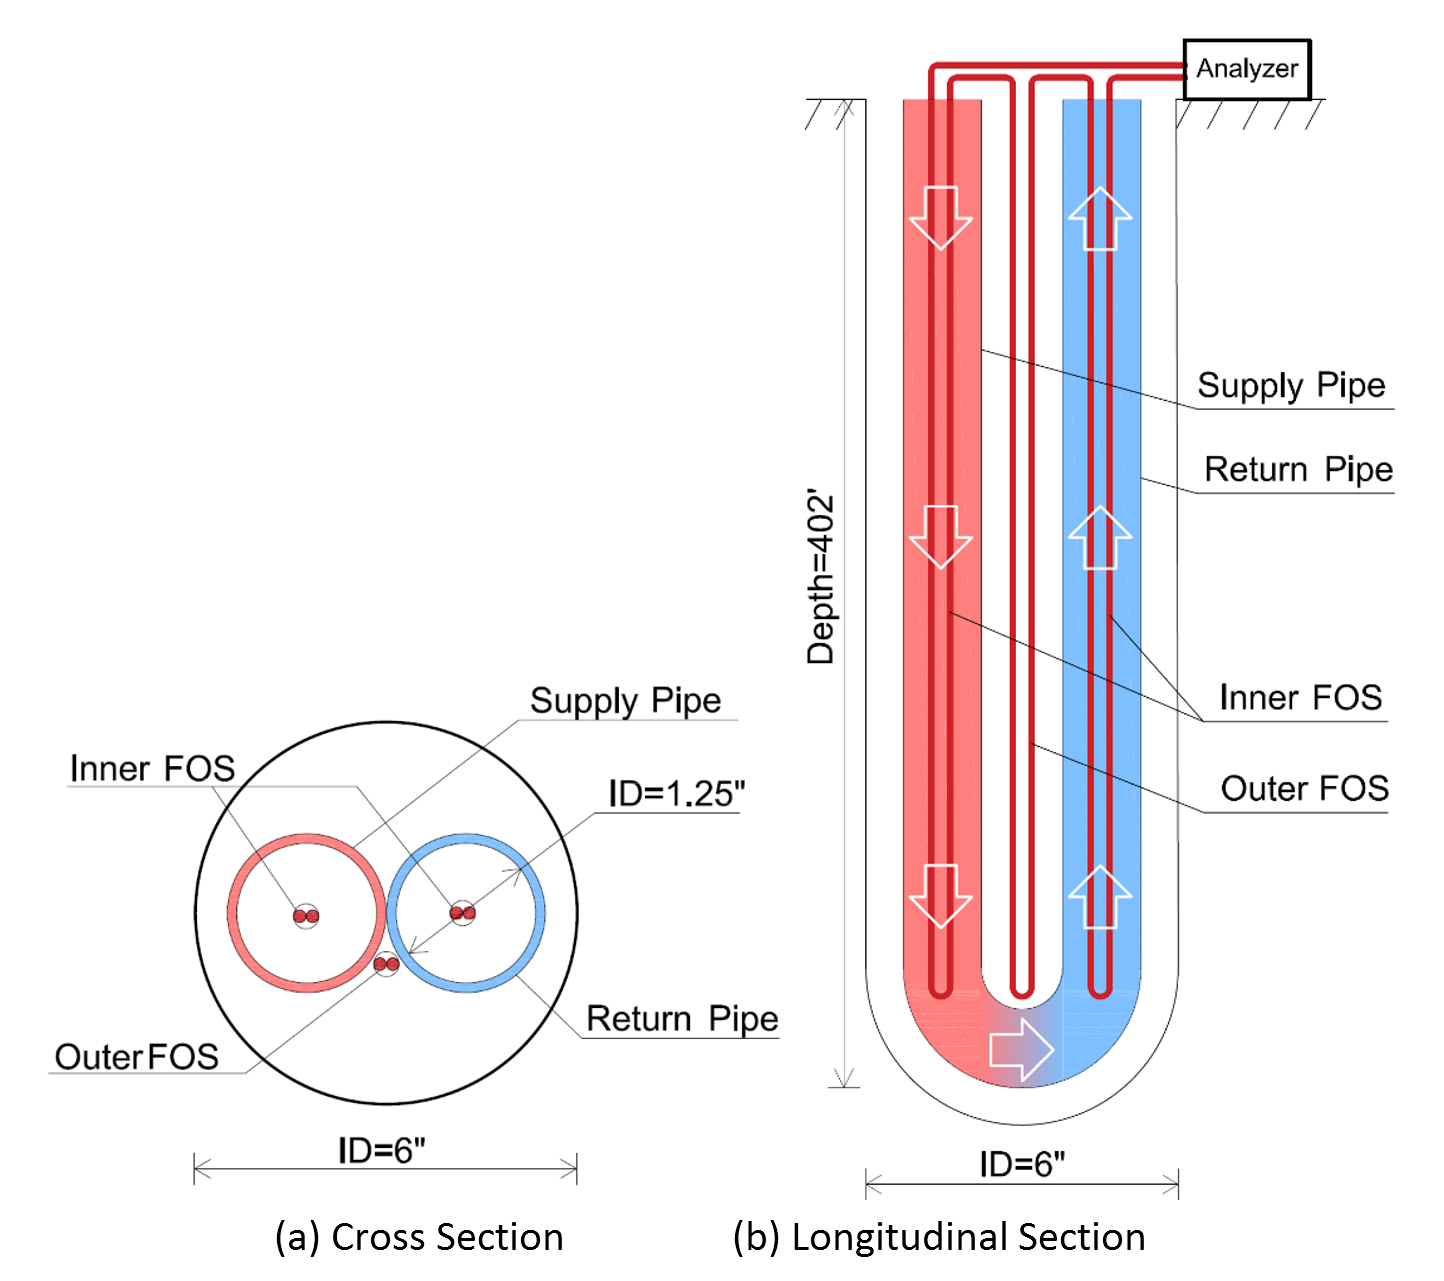
Figure 1 Borehole Configuration
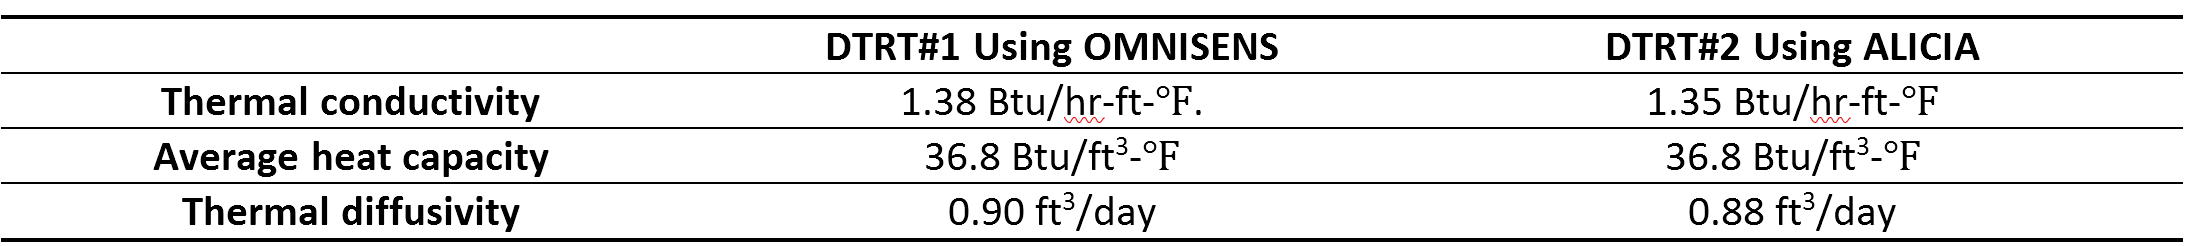
The first DTRT was performed between Sep. 2 and 4, 2022, with a heating phase of 46.6 hours followed by a temperature decay phase of 12 hours. The second DTRT was performed between Sep. 31 and Oct. 4, 2022, with a heating phase of 47 hours followed by a temperature decay phase of 24 hours. Average geothermal properties calculated by conventional line source method are shown in Table 1.
Table 1 Summary Thermal Properties of Two DTRTs
Temperature change recorded by DFOS in two DTRTs are shown in Figure 1.1 – 1.9 and Figure 2.1 – 2.9, respectively. Main conclusions are summarized as follows:
- DFOS performed well in recording the spatiotemporal variability of temperature change during DTRTs. Temperature measured by DFOS near the ground surface match well with temperature recorded by the thermometer in the TRT Rig.
- In the heating phase, the temperature change is linear to the natural log time, but the slope of the curve is changing along depth due to variation of geothermal properties. In the temperature decay phase, curves of temperature change versus elapsed time are not linear and become gentler with time. It is due to the dissipation of residual heat from the borehole to the ground, which will be further studied through more advanced numerical analysis.
- The profiles of temperature change versus depth generally show a “V” shape, and the temperatures in the supply and return pipes converge at the depth of 250 ft. This means the heat transfer efficiency is very low below 250 ft, which is probably due to the poor grouting quality.
- DFOS installed inside the U-pipe has better performance than DFOS outside the U-Pipe. As expected, DFOS outside the pipe recorded a lower temperature. Due to the uncertainty in its positions, the DFOS data from the outside of the U-pipe suffer data fluctuation. It was not possible to measure the temperature difference between the supply and return pipes.
Click HERE for detailed data…