Community Geothermal Modeling of UC Berkeley Campus
With the increasingly deteriorating state of the existing campus energy delivery system, UCB recognizes the need for a holistic and long-term study of the future of its campus energy delivery system. The objective of this work is to investigate the feasibility of upgrading the existing campus energy delivery system at UC Berkeley (UCB) to a fifth-generation district heating and cooling system (5GDHC) that includes geothermal heat/cold storage.
 |
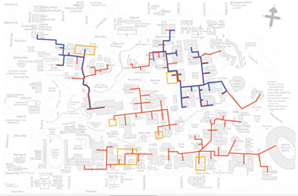 |
| Campus zoning – nodal energy delivery approach | Plant siting and distribution routing basis (Plant sites shown in yellow boxes; heating hot water (HHW) distribution routings shown in red lines; chilled water (CW) distribution routings shown in blue lines) |
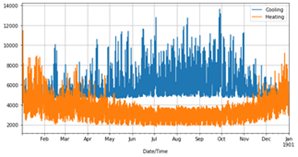
Unscaled annual space heating/cooling and domestic hot water (DHW) load profiles are developed for each building and scaled to match both the measured peak loads and the measured electricity use intensities (EUIs) (Arup North America Ltd (2015)). Take Bioscience node as an example, an open space around Tolman Hall is selected for potential borehole installation. The size of the ground source heat pump (GSHP) is designed to cover part of Bioscience node’s heating and cooling demands.
 |
 |
| Scaled load profile of the Bioscience node | Annual steam use intensity (kBtu/sqft*yr) |
 |
 |
| Utility pipelines | Potential area for GSHP installation |
 |
 |
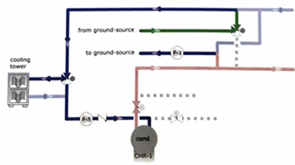
| Supplemental heat rejection location downstream of ground-source | Water to water heat pump system coupled with a geothermal borefield |
To help build the UCB underground geothermal model, the project team is developing an underground geological and geotechnical information system database of the UCB campus. Geotechnical reports from past building projects have been checked for soil properties, exploratory boring log, surface elevation and water level. The project team has been collaborating with the UCB’s facilities service department to install distributed fiber optic temperature sensors inside two geotechnical site investigation boreholes at O’Brien Hall with 30 feet depth and at Digital Hub Building with 70 feet depth.
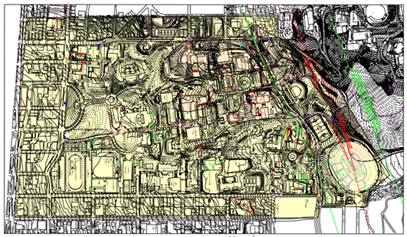
| Campus topology and exploratory boring locations |
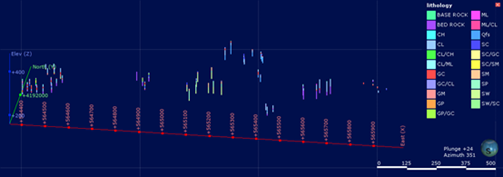 |
| Boring data visualization |
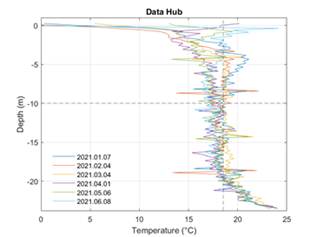 |
| Monthly temperature profile monitoring (from Jan 2021 to June 2021) |
The model is constructed based on the 3D geologic map of the Hayward fault zone. The length and width of the model is approximately 1770 m and 1129 m, respectively. The model height varies from 310 m (southwest corner) to 574 m (northeast corner). The mesh size varies from 2 m to 25 m, which is refined around the borehole area. It contains around 1.3 million hexahedral elements in total.
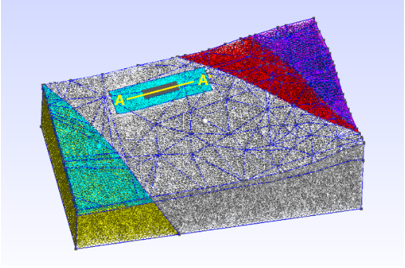
Mesh generated using Gmsh
A coupled hydrothermal simulator is developed with C++ based on the open-source finite element library deal.II. The total simulation time is 20 years with a 20 days time interval. Some sample simulation results are shown below.

Resulting temperature profile across borehole area (section A-A’) at around 100 m depth at April (left) and October (right)
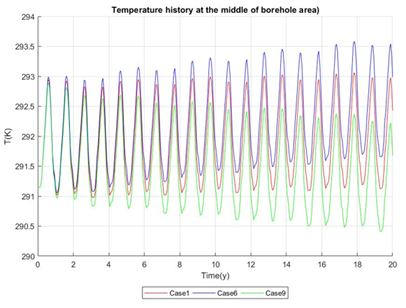
Ground temperature history at the middle of borehole area for cases with different input building demands
1D Heat Loss Models to Predict the Aquifer Temperature Profile
In an open-loop GSHP system, geothermal storage is used for seasonal purposes; hot water is injected into the aquifer during summer and this heat is reused or extracted during winter. In general, 2D and 3D numerical models are used to evaluate the thermal performance of the aquifer used for heat/cold storage. However, assuming sufficient accuracy, a simplified 1D model would be attractive to conduct many scenario-testing simulations because of its low computational cost.

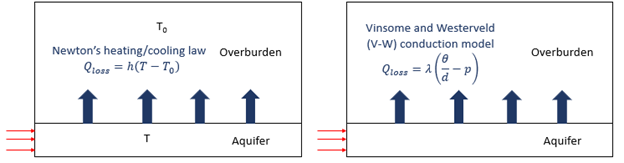
To model the heat loss from the aquifer to the overburden/underlying layers, two heat loss models (Newton’s heating/cooling law and the Vinsome and Westerveld (V-W) conduction model (Vinsome and Westerveld, 1980)) are included in the 1D energy transport equation.
To examine the performance of the proposed 1D models, a full 2D axisymmetric COMSOL benchmark model is developed, where a half-model aquifer layer is coupled with an overburden layer.
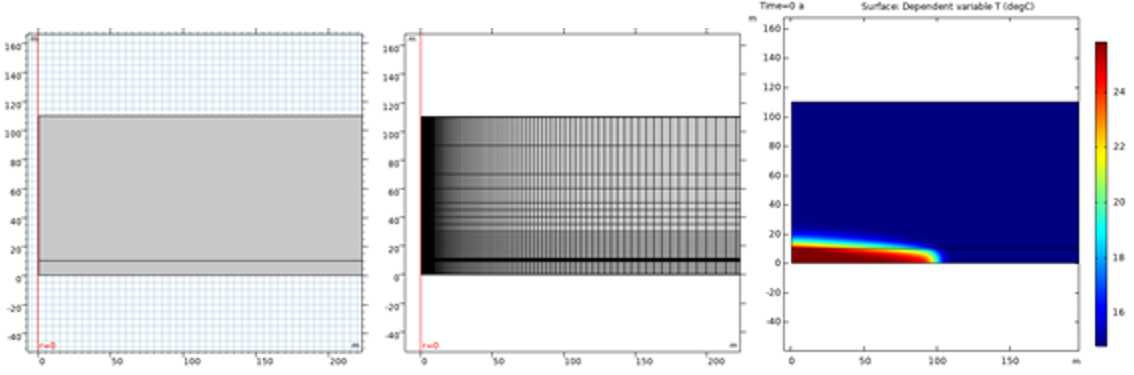
A full 2D Comsol benchmark simulation model

Average temperature distribution comparison along the radius between the 1D model predictions and benchmark results with injection period changing from 1 to 5 years
Based on the parameter sensitivity analysis, we found that 1D Newton analytical model is better for the advection-dominated condition, while 1D V-W numerical model is better for the conduction-dominated condition.
- The advection-dominated condition (1D Newton analytical model)
- Short injection period with short diffusion length (1 year)
- Thick aquifer (>20m)
- Low aquifer thermal conductivity (<2.2W/mK)
- The conduction-dominated condition (1D V-W numerical model)
- Long injection period with long diffusion length (>5 year)
- Thin aquifer (<20m)
- High aquifer thermal conductivity (>2.2W/mK)