The city-scale research team recently published a paper in the Cambridge Journal of Data-Centric Engineering that uses innovative sources of real-world data to calibrate a widely used empirical relationship in traffic engineering [1]. The paper aims to address the difficulty of calibrating the macroscopic relationship between traffic volume and speed. Specifically, it combines the traffic volume data from Transport for London’s Automated Traffic Counters (Figure 1a) and the travel time data from Google Maps’ Directions API (Figure 1b), at corresponding times and locations in the Greater London Area. Based on it, three mathematical models are compared regarding their fitting to the observed data (Figure 2). Overall, the methodology approach proposed in this paper demonstrates the possibility of gaining a more context-specific understanding of the city-scale road network at more fine-grained resolutions. This would benefit the transportation planning by pinpointing the bottlenecks in fast-changing traffic environments (e.g., identifying locations with lower capacity than designed, or locations that are sensitive to increasing demand). However, limited by the availability of the traffic volume data and the increasing difficulty/cost of obtaining crowd-sourced data from vendors such as Google Maps, there is still a need for more open data and technology innovations to scale the approach up to cover the whole city.
[1] Casey, G., Zhao, B., Kumar, K., & Soga, K. (2020). Context-specific volume–delay curves by combining crowd-sourced traffic data with automated traffic counters: A case study for London. Data-Centric Engineering,1, E18. doi:10.1017/dce.2020.18
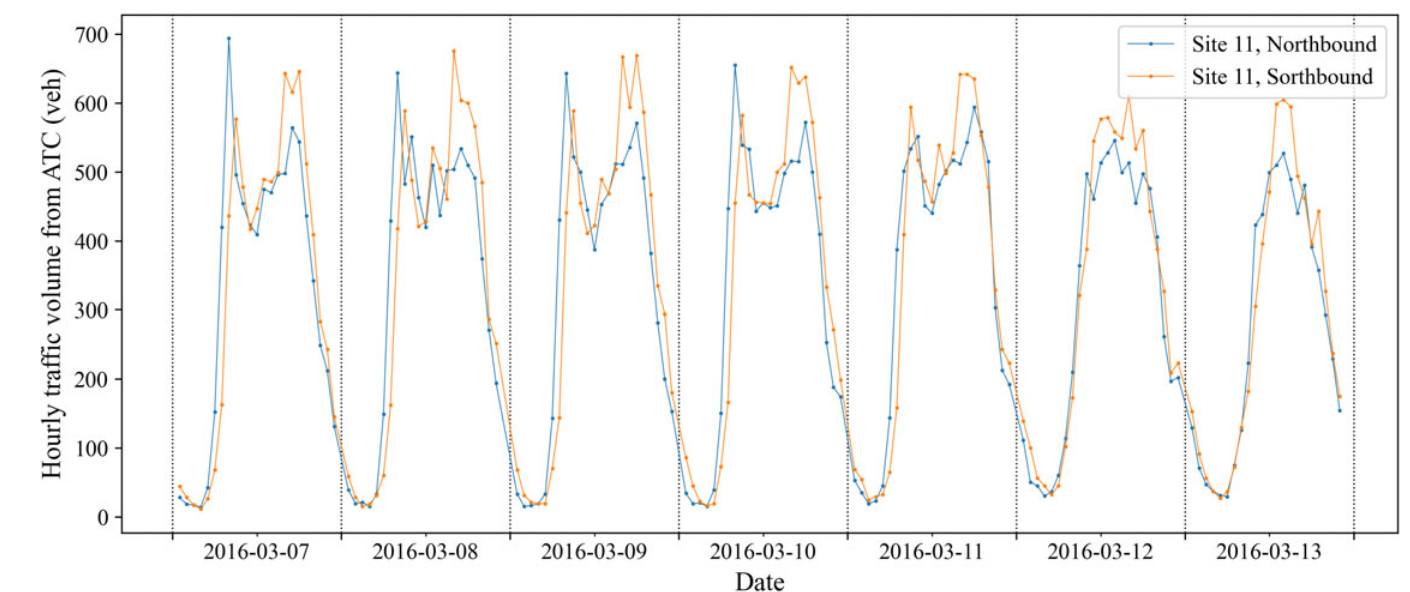
(a) Traffic volume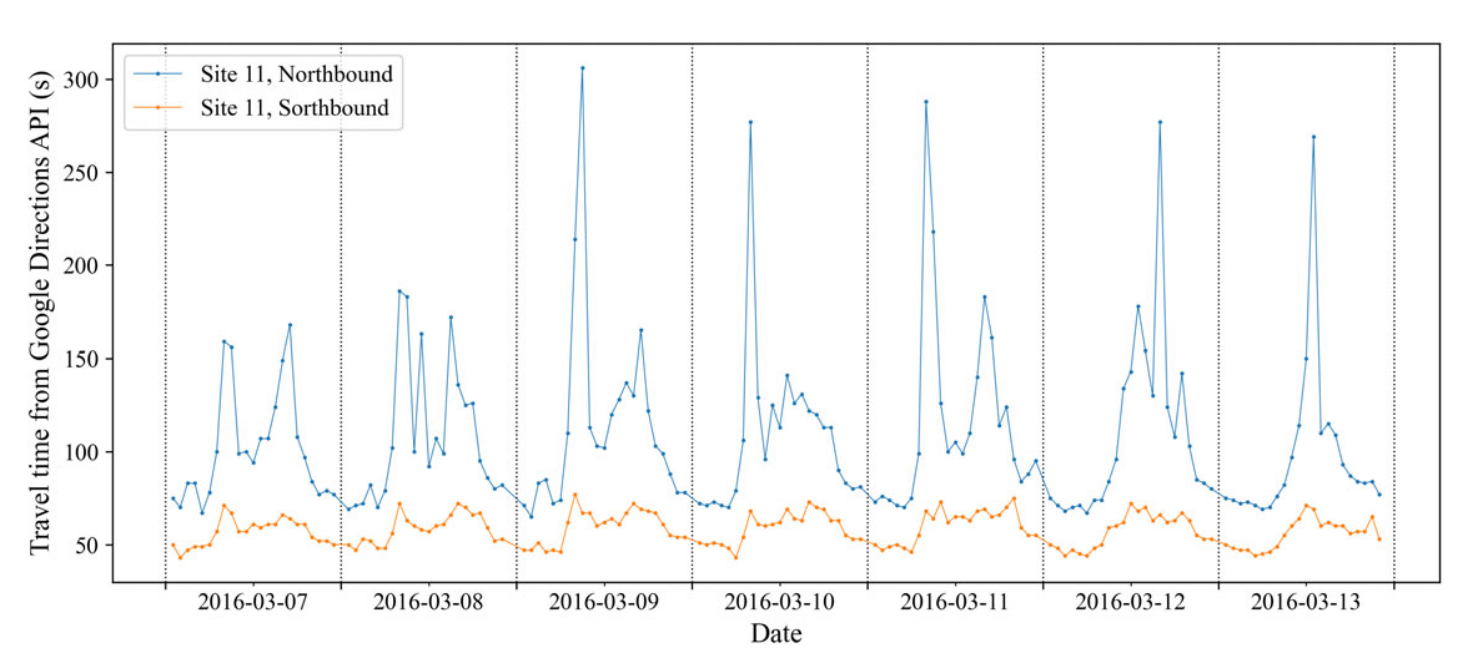
(b) Travel times
Figure 1. Example of the empirical data of the Royal Parade road, London (A208).
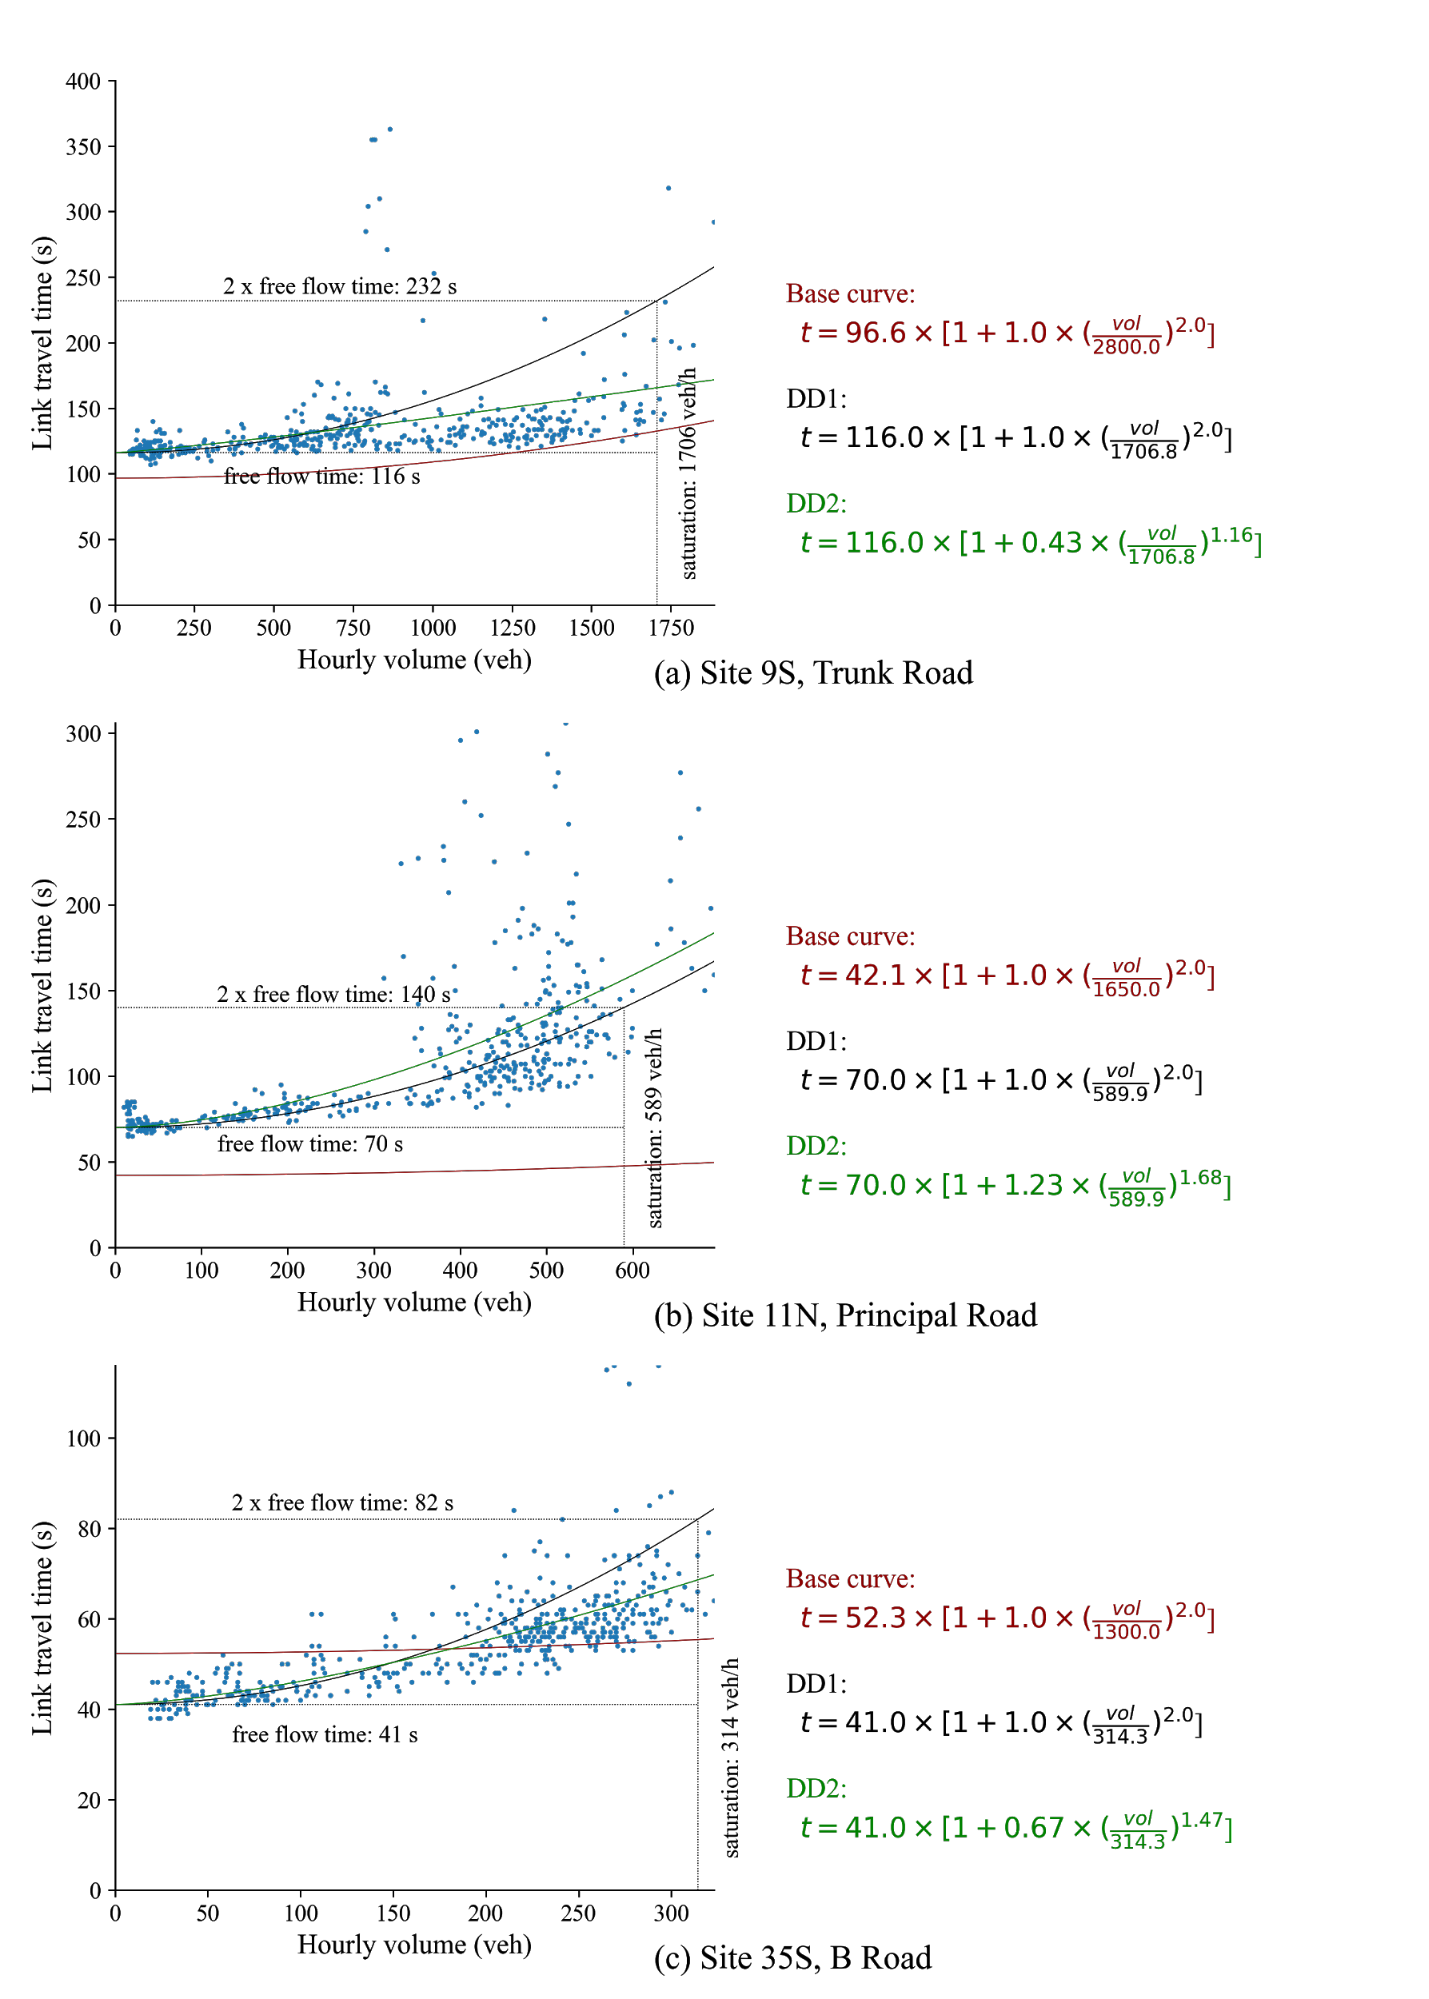
Figure 2. Fitting the observed data with three regression models at three sites.